Logs
Tip
We don’t create anything in this subchapter that will be needed in any subsequent (sub)chapters, so if logs don’t interest you feel free to just skip this subchapter.
Here are some of the general challenges of logging in a microservices application:
- Understanding the end-to-end processing of a client request, where multiple services might be invoked to handle a single request.
- Consolidating logs from multiple services into a single aggregated view.
- Parsing logs that come from multiple sources, which use their own logging schemas or have no particular schema. Logs may be generated by third-party components that you don’t control.
- Microservices architectures often generate a larger volume of logs than traditional monoliths, because there are more services, network calls, and steps in a transaction. That means logging itself can be a performance or resource bottleneck for the application.
There are some additional challenges for a Kubernetes-based architecture:
- Containers can move around and be rescheduled.
- Kubernetes has a networking abstraction that uses virtual IP addresses and port mappings.
In Kubernetes, the standard approach to logging is for a container to write logs to stdout and stderr. The container engine redirects these streams to a logging driver, at the very least storing them individually on each executing node. For ease of querying, and to prevent possible loss of log data if a node crashes, the usual approach is to collect the logs from each node and send them to a central storage location.
Many organizations use Fluentd with Elasticsearch, running either within the Kubernetes cluster or externally hosted by a service provider. Fluentd is an open-source data collector and a Cloud Native Computing Foundation graduated project, and Elasticsearch is a document database that is for search.
A fast, lightweight, and highly scalable alternative to Fluentd is Fluent-Bit. Fluent-Bit is the preferred choice for cloud and containerized environments and is part of the Fluentd organization.
Both, Fluent-Bit and Elasticsearch, are already predefined in our Kubernetes cluster, the former using the Fluent Bit Helm Chart and the latter using the Elastic Cloud on Kubernetes (ECK) Helm Chart (ECK-Stack) .
Exercise - Explore Elasticsearch
First let’s take a look which Custom Resource Definitions (CRD) the Operator provides:
kubectl get crd | grep -e '^NAME' -e 'elastic.co'
NAME                                                   CREATED AT
agents.agent.k8s.elastic.co                            2025-03-26T13:40:29Z
apmservers.apm.k8s.elastic.co                          2025-03-26T13:40:29Z
beats.beat.k8s.elastic.co                              2025-03-26T13:40:29Z
elasticmapsservers.maps.k8s.elastic.co                 2025-03-26T13:40:29Z
elasticsearchautoscalers.autoscaling.k8s.elastic.co    2025-03-26T13:40:29Z
elasticsearches.elasticsearch.k8s.elastic.co           2025-03-26T13:40:30Z
enterprisesearches.enterprisesearch.k8s.elastic.co     2025-03-26T13:40:29Z
kibanas.kibana.k8s.elastic.co                          2025-03-26T13:40:30Z
logstashes.logstash.k8s.elastic.co                     2025-03-26T13:40:29Z
stackconfigpolicies.stackconfigpolicy.k8s.elastic.co   2025-03-26T13:40:29Z
Of these we only use elasticsearches and kibanas here. What is the state of our elasticsearch?
kubectl get elasticsearch --selector app.kubernetes.io/name=eck-elasticsearch --namespace logging
NAME            HEALTH   NODES   VERSION   PHASE   AGE
elasticsearch   yellow    1       8.17.0    Ready   60m
Huh, HEALTH is only yellow? Well, we installed a minimal Elasticsearch cluster consisting of only a single node (cf. NODES showing 1), so there cannot be any data redundancy, and hence the cluster health will never be green. But as long as it is not red and the PHASE remains Ready this should suffice.
Let’s first get the access credentials from a secret stored by the Operator (just like we had with the Postgres Operator already):
export ELASTICPASSWORD=$(kubectl get secret --namespace logging elasticsearch-es-elastic-user --output go-template='{{.data.elastic | base64decode}}')
With that we can query the Elasticsearch cluster, getting some general information:
curl --silent --user "elastic:$ELASTICPASSWORD" https://zwtj1.elasticsearch.cloudtrainings.online
{
  "name": "elasticsearch-es-default-0",
  "cluster_name": "elasticsearch",
  "cluster_uuid": "kTeJp6oDTomSiKai-Kku8Q",
  "version": {
    "number": "8.17.0",
    "build_flavor": "default",
    "build_type": "docker",
    "build_hash": "2b6a7fed44faa321997703718f07ee0420804b41",
    "build_date": "2024-12-11T12:08:05.663969764Z",
    "build_snapshot": false,
    "lucene_version": "9.12.0",
    "minimum_wire_compatibility_version": "7.17.0",
    "minimum_index_compatibility_version": "7.0.0"
  },
  "tagline": "You Know, for Search"
}
List Compact and aligned text (CAT) APIs :
curl --silent --user "elastic:$ELASTICPASSWORD" https://zwtj1.elasticsearch.cloudtrainings.online/_cat
/_cat/allocation
/_cat/shards
/_cat/shards/{index}
/_cat/master
/_cat/nodes
/_cat/tasks
/_cat/indices
/_cat/indices/{index}
/_cat/segments
/_cat/segments/{index}
/_cat/count
/_cat/count/{index}
/_cat/recovery
/_cat/recovery/{index}
/_cat/health
/_cat/pending_tasks
/_cat/aliases
/_cat/aliases/{alias}
/_cat/thread_pool
/_cat/thread_pool/{thread_pools}
/_cat/plugins
/_cat/fielddata
/_cat/fielddata/{fields}
/_cat/nodeattrs
/_cat/repositories
/_cat/snapshots/{repository}
/_cat/templates
/_cat/component_templates/_cat/ml/anomaly_detectors
/_cat/ml/anomaly_detectors/{job_id}
/_cat/ml/datafeeds
/_cat/ml/datafeeds/{datafeed_id}
/_cat/ml/trained_models
/_cat/ml/trained_models/{model_id}
/_cat/ml/data_frame/analytics
/_cat/ml/data_frame/analytics/{id}
/_cat/transforms
/_cat/transforms/{transform_id}
Now the cluster health:
curl --silent --user "elastic:$ELASTICPASSWORD" "https://zwtj1.elasticsearch.cloudtrainings.online/_cat/health?v"
epoch      timestamp cluster       status node.total node.data shards pri relo init unassign unassign.pri pending_tasks ... active_shards_percent
1743492716 07:31:56  elasticsearch yellow          1         1     33  33    0    0        2            0             0   -                 94.3%
And what indices for storing data already exist:
curl --silent --user "elastic:$ELASTICPASSWORD" "https://zwtj1.elasticsearch.cloudtrainings.online/_cat/indices?v" | grep -e '^health' -e logstash -e node
health status index               uuid                   pri rep docs.count docs.deleted store.size pri.store.size dataset.size
yellow open   logstash-2025.04.01 Ml_gOw-tSBeyc8mL-tDWtA   1   1       2102            0      1.9mb          1.9mb        1.9mb
yellow open   node-2025.04.01     R_I9g2jPRzqykYTTjE5mDA   1   1         36            0    156.5kb        156.5kb      156.5kb
Exercise - Explore log data stored in Elasticsearch
Tip
If you just want to investigate the log data using a web interface then please jump forward to Kibana . Here we start accessing data using the raw API now. Please note that you will miss some adjustments then that we are about to apply to our setup, so you might want to revisit the following exercises later on.
Using the HTTP API we can also query what has been stored in our Elasticsearch cluster, for example what is today’s most recent log entry overall, yielding all data available (i.e. raw log data as well as parsed data):
curl --silent --user "elastic:$ELASTICPASSWORD" \
    "https://zwtj1.elasticsearch.cloudtrainings.online/logstash-$(date +%Y.%m.%d)/_search?pretty" \
    --header 'Content-Type: application/json' --data @- <<.EOF
{
  "query": {
    "match_all": {}
  },
  "sort": [
    {
      "@timestamp": "desc"
    }
  ],
  "from": 0,
  "size": 1
}
.EOF
Or what is today’s most recent log entry in our individual namespace, but let’s only display a subset of the result data:
Tip
Before executing make sure the variable $NAMESPACE is still available from Ingress Controller - Namespaces .
curl --silent --user "elastic:$ELASTICPASSWORD" \
    "https://zwtj1.elasticsearch.cloudtrainings.online/logstash-$(date +%Y.%m.%d)/_search?pretty" \
    --header 'Content-Type: application/json' --data @- <<.EOF
{
  "query": {
    "match_phrase": {
      "kubernetes.namespace_name": "$NAMESPACE"
    }
  },
  "sort": [
    {
      "@timestamp": "desc"
    }
  ],
  "from": 0,
  "size": 10,
  "_source": [
    "@timestamp",
    "log",
    "stream",
    "kubernetes.pod_name",
    "kubernetes.container_name"
  ]
}
.EOF
which could yield something along the lines of
{
  "took": 38,
  "timed_out": false,
  "_shards": {
    "total": 1,
    "successful": 1,
    "skipped": 0,
    "failed": 0
  },
  "hits": {
    "total": {
      "value": 284,
      "relation": "eq"
    },
    "max_score": null,
    "hits": [
      {
        "_index": "logstash-2025.04.01",
        "_id": "smhP8JUBiV9UiUN_0Plq",
        "_score": null,
        "_source": {
          "@timestamp": "2025-04-01T07:45:16.700Z",
          "stream": "stdout",
          "log": "Hibernate: select t1_0.todo from todo t1_0",
          "kubernetes": {
            "pod_name": "todobackend-7d6f7bbf9c-tn47z",
            "container_name": "todobackend"
          }
        },
        "sort": [1743493516700]
      },
      {
        "...": "..."
      }
    ]
  }
}
Exercise - Generate and retrieve log data
Let’s generate some easy-to-digest log data within our cluster. In another terminal execute
kubectl run count --image busybox --command -- sh -c 'i=0; while sleep 2; do echo "$i: $(date)"; i=$((i+1)); done' && kubectl get pod count --watch
Once the Pod is running we can check when the fluent-bit Pod running on the corresponding node will start picking up its log file for forwarding to Elasticsearch:
kubectl logs --selector app.kubernetes.io/name=fluent-bit --namespace logging --tail 1000 --follow \
    | grep "count_${NAMESPACE}_count-$(kubectl get pod count -o jsonpath='{.status.containerStatuses[].containerID}' | cut -d'/' -f3)"
This might take up to 30 seconds for noticing there is a new file for forwarding, and then look like this:
[2025/04/01 14:32:40] [ info] [input:tail:tail.0] inotify_fs_add(): inode=42231 watch_fd=64 name=/var/log/containers/count_<your_namespace>_count-<your_container_id>.logKill the count Pod again by Ctrl+C on the watch terminal from above and then execute kubectl delete pod count.
Exercise - Access log data using Kibana
Of course, while querying log data via curl is convenient, and the HTTP API opens up the door for any subsequent log
data processing, we humans might prefer a different interface for digesting our logs. What is the state of our Kibana in
the cluster:
kubectl get kibana --selector app.kubernetes.io/name=eck-kibana --namespace logging
NAME                       HEALTH   NODES   VERSION   AGE
elastic-stack-eck-kibana   green    1       8.17.0    7h46m
There is an Ingress for accessing the Kibana Dashboard, execute
kubectl get ingresses --selector app.kubernetes.io/name=eck-kibana --namespace logging
to find the host to access Kibana through your local browser at
https://zwtj1.kibana.cloudtrainings.online
. Access Kibana with user: elastic and password:
echo $ELASTICPASSWORD (see above).
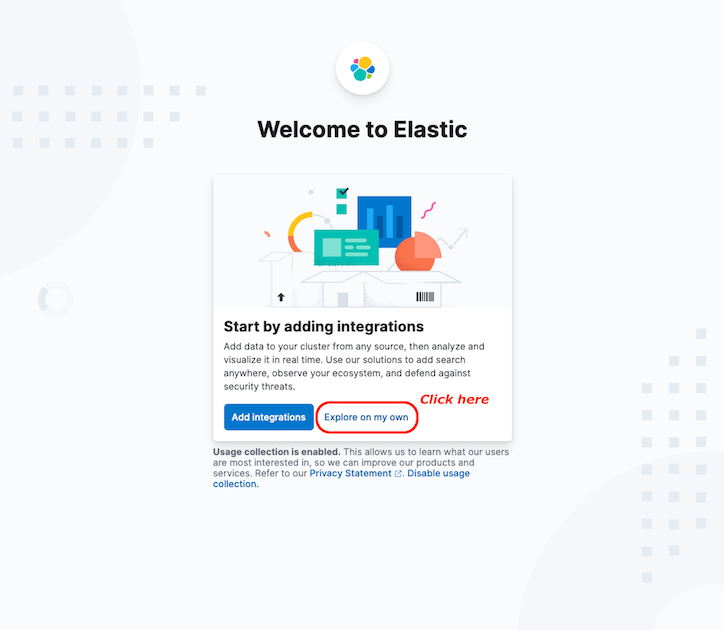
If you see the Welcome page, just click on Explore on my own:
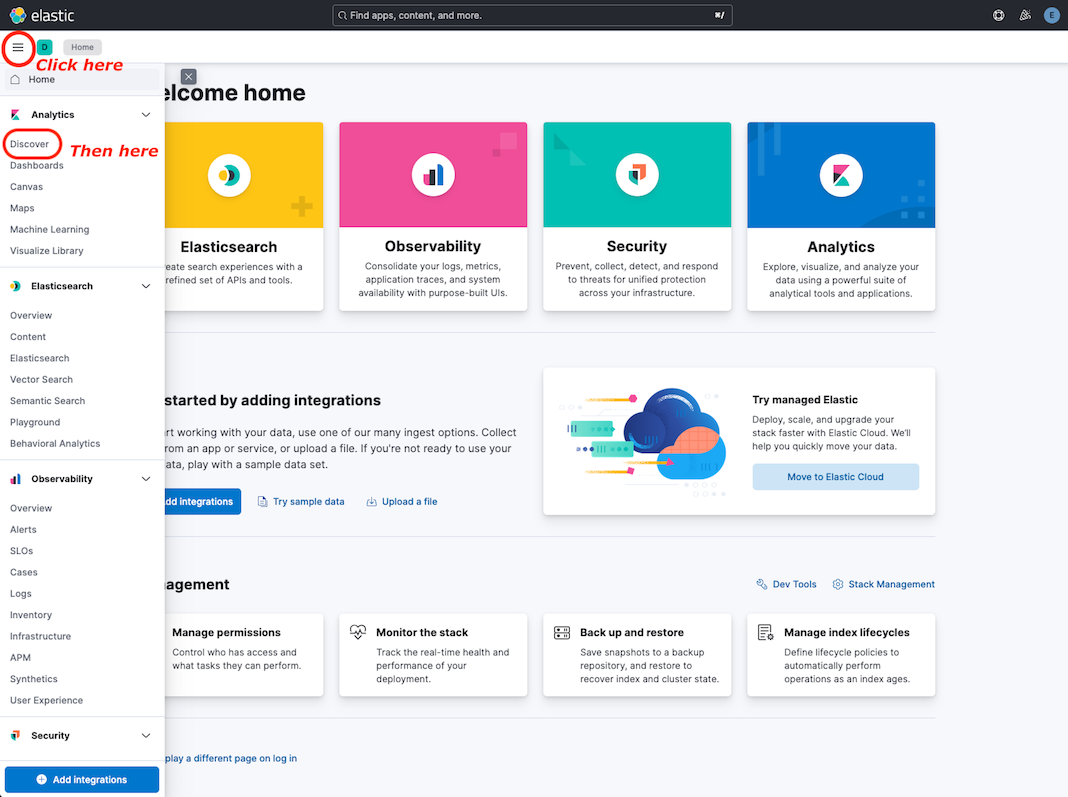
You should see the Home page like in the following picture:
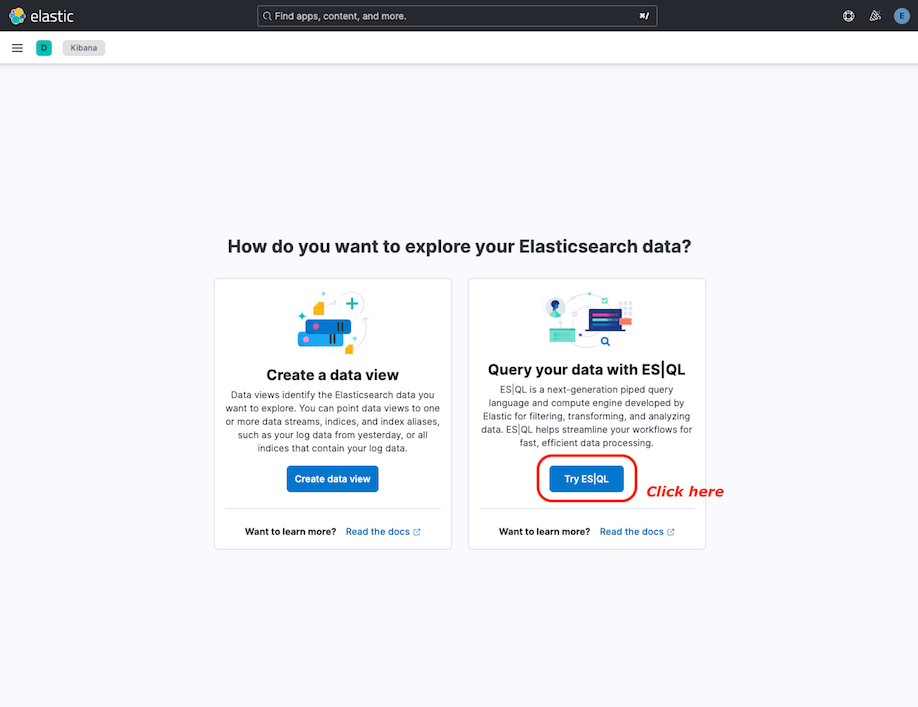
If you see the Explore page, just click on Try ES|QL:
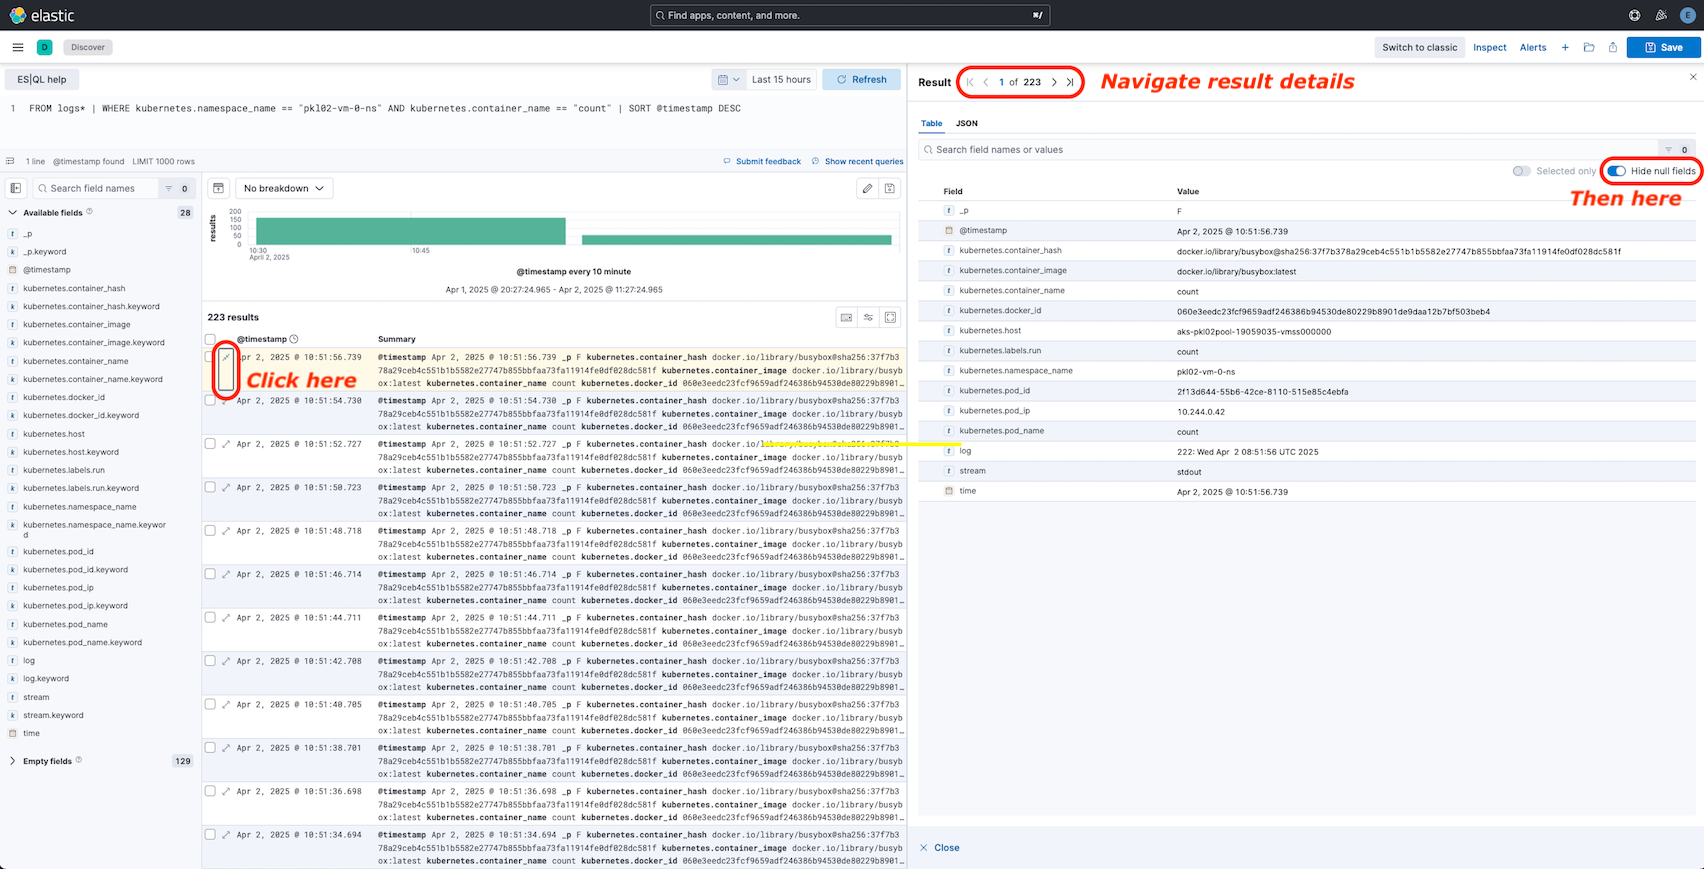
In Kibana you can query for logs with specific values. As you can remember the created Pod with the date output have the name count. So search this container by adding the query
FROM logs* | WHERE kubernetes.namespace_name == "<your_namespace>" AND kubernetes.container_name == "count" | SORT @timestamp DESC
to the Search field, replacing <your_namespace> and run it. If you do not get any results, change the date range
for your search in the Date quick select:
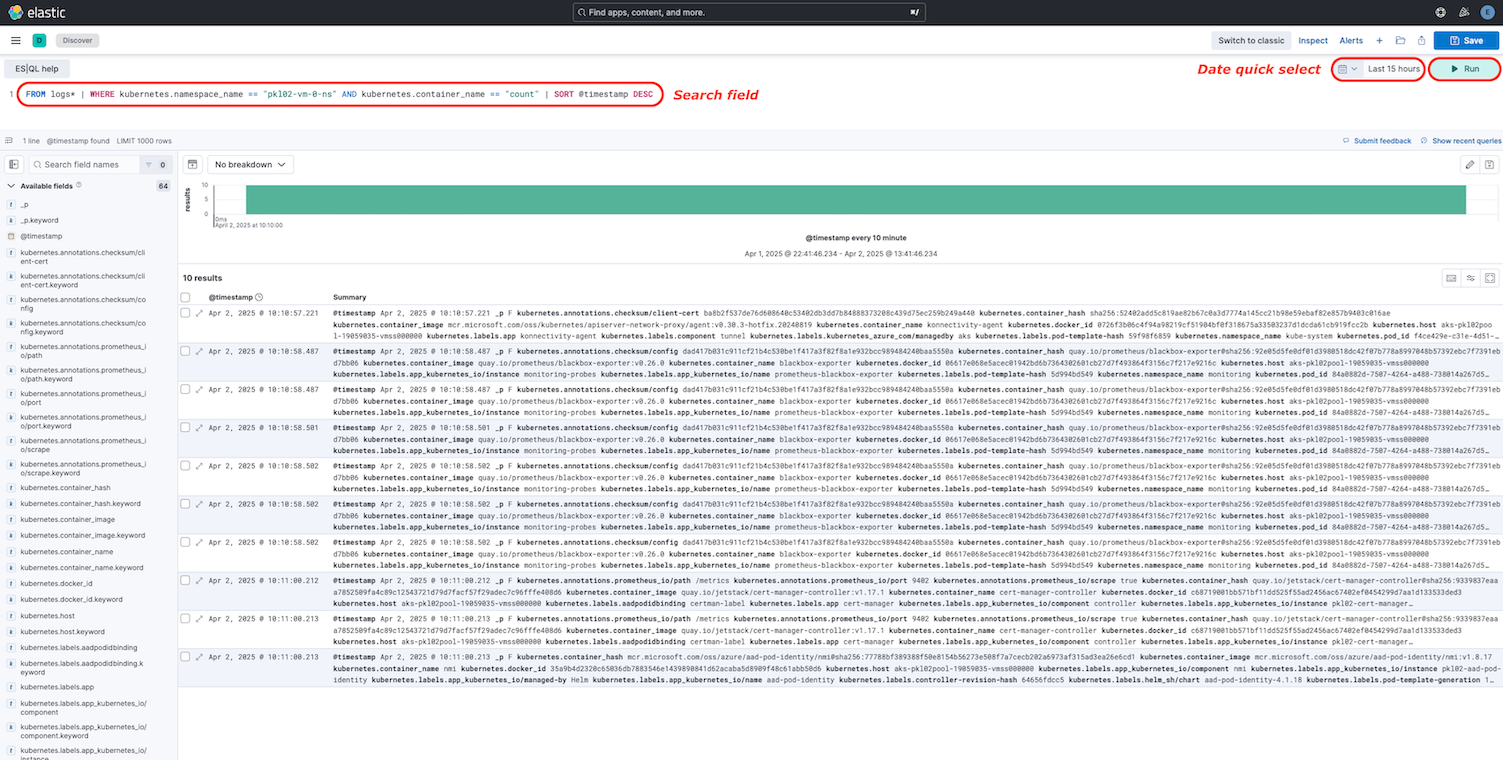
In the log field you can see the date output from the executed container. Some other useful information is provided here
by Kibana. Click on Toggle dialog with details to get detail information about the logs. Hide null fields if
they are not already hidden. To navigate through the result details use the navigation bar Result |< < 1 of 223 > >|: