Runtime
So far the steps done with Kubernetes are very similar to what was set up with plain Docker previously. However running workloads in Kubernetes offer much more potential in terms of
- automatic recovery from failure
- scaling of instances
- load-balancing between instances
- isolation of failed components
- zero-downtime deployments when patching to a new version
This exercise will walk through all those steps on the basis of the deployed application. Please bear with us, all in all this will take a bit longer than the previous exercises.
Exercise - Expose backend application directly
At this point the only application component, which is exposed as LoadBalancer type is the UI. From a security perspective this is all the way correct.
kubectl get svc
NAME          TYPE           CLUSTER-IP     EXTERNAL-IP     PORT(S)          AGE
postgresdb    ClusterIP      10.0.124.93    <none>          5432/TCP         10m
todobackend   ClusterIP      10.0.3.171     <none>          8080/TCP         11m
todoui        LoadBalancer   10.0.135.115   20.23.133.170   8090:32023/TCP   11m
graph LR;
A{Internet} -->|LoadBalancer:8090| B
subgraph Kubernetes
subgraph s1["Deployment -> Pod"]
B(todoui)
end
subgraph s2["Deployment -> Pod"]
C(todobackend)
B -->|ClusterIP:8080| C
end
subgraph s3["Deployment -> Pod"]
D(postgresdb)
C -->|ClusterIP:5432| D
end
end
We will use the backend component to demonstrate Kubernetes capabilities, so exposing this as LoadBalancer.
nano todobackend-service.yaml
Change
type: ClusterIPto
type: LoadBalancerSave and inspect what would change if we were to apply this file now to the current state of the cluster:
kubectl diff -f todobackend-service.yaml
And then apply it again:
kubectl apply -f todobackend-service.yaml
the service definition should switch immediately:
NAME          TYPE           CLUSTER-IP     EXTERNAL-IP     PORT(S)          AGE
postgresdb    ClusterIP      10.0.124.93    <none>          5432/TCP         11m
todobackend   LoadBalancer   10.0.3.171     20.82.83.63     8080:31332/TCP   12m
todoui        LoadBalancer   10.0.135.115   20.23.133.170   8090:32023/TCP   12m
graph LR;
A{Internet} -->|LoadBalancer:8090| B
A -->|LoadBalancer:8080| C
subgraph Kubernetes
subgraph s1["Deployment -> Pod"]
B(todoui)
end
subgraph s2["Deployment -> Pod"]
C(todobackend)
B -->|ClusterIP:8080| C
end
subgraph s3["Deployment -> Pod"]
D(postgresdb)
C -->|ClusterIP:5432| D
end
end
Milestone: K8S/RUNTIME/TODOBACKEND-SERVICE
Validate access via the “/hello” endpoint:
curl <EXTERNAL-IP>:<PORT>/hello; echo
which will result in something like:
todobackend-67fd9b6c69-qqs7p Hallo, Welt !What you can see here is the hostname within the container (which includes the ReplicaSet and Pod Id) and a “Hello, World” statement.
Exercise - Crash the application
Also invoke an endpoint, which causes the app to crash:
curl <EXTERNAL-IP>:<PORT>/fail
You will get an error response, if anything at all:
curl: (52) Empty reply from serverAnd you can observe the output in the overview:
NAME                               READY   STATUS    RESTARTS     AGE
pod/postgresdb-6c9bd7c5d8-kd4lw    1/1     Running   0            26m
pod/todobackend-67fd9b6c69-qqs7p   0/1     Error     0            5m31s
pod/todoui-6767f8695c-glcmn        1/1     Running   0            18m
However Kubernetes will bring this back after a short while:
NAME                               READY   STATUS    RESTARTS     AGE
pod/postgresdb-6c9bd7c5d8-kd4lw    1/1     Running   0            26m
pod/todobackend-67fd9b6c69-qqs7p   1/1     Running   1 (2s ago)   5m36s
pod/todoui-6767f8695c-glcmn        1/1     Running   0            18m
and you can see that there was one restart.
Exercise - Open a new window with a while loop
To visualize this behavior a little better open a new terminal window. Within this window run a constant while loop to ping the application:
while sleep 1; do curl <EXTERNAL-IP>:<PORT>/hello; echo; done
This should come up with:
todobackend-67fd9b6c69-qqs7p Hallo, Welt !
todobackend-67fd9b6c69-qqs7p Hallo, Welt !
todobackend-67fd9b6c69-qqs7p Hallo, Welt !
todobackend-67fd9b6c69-qqs7p Hallo, Welt !
and will continuously run.
Exercise - Crash the application again
Back in your previous terminal window repeat the call
curl <EXTERNAL-IP>:<PORT>/fail
And you will see an interruption of the service:
todobackend-67fd9b6c69-qqs7p Hallo, Welt !
todobackend-67fd9b6c69-qqs7p Hallo, Welt !
curl: (7) Failed to connect to 20.82.83.63 port 8080: Connection refused

curl: (7) Failed to connect to 20.82.83.63 port 8080: Connection refused

curl: (7) Failed to connect to 20.82.83.63 port 8080: Connection refused

curl: (7) Failed to connect to 20.82.83.63 port 8080: Connection refused
This will go on for a bit until Kubernetes discovers and restarts:
curl: (7) Failed to connect to 20.82.83.63 port 8080: Connection refused

curl: (7) Failed to connect to 20.82.83.63 port 8080: Connection refused

todobackend-67fd9b6c69-qqs7p Hallo, Welt !
todobackend-67fd9b6c69-qqs7p Hallo, Welt !
todobackend-67fd9b6c69-qqs7p Hallo, Welt !
Exercise - Scale the instances of the application
One way to improve application resilience is to provide redundancy copies. For that invoke:
kubectl scale deployment todobackend --replicas 3
Milestone: K8S/RUNTIME/TODOBACKEND-SCALE
This will change the output in your kubectl get all information:
NAME                               READY   STATUS    RESTARTS       AGE
pod/postgresdb-6c9bd7c5d8-kd4lw    1/1     Running   0              30m
pod/todobackend-67fd9b6c69-qqs7p   1/1     Running   1 (4m1s ago)   9m35s
pod/todobackend-67fd9b6c69-rlrv2   1/1     Running   0              4s
pod/todobackend-67fd9b6c69-zm622   1/1     Running   0              4s
pod/todoui-6767f8695c-glcmn        1/1     Running   0              22m

NAME                  TYPE           CLUSTER-IP     EXTERNAL-IP     PORT(S)          AGE
service/postgresdb    ClusterIP      10.0.124.93    <none>          5432/TCP         16m
service/todobackend   LoadBalancer   10.0.3.171     20.82.83.63     8080:31332/TCP   17m
service/todoui        LoadBalancer   10.0.135.115   20.23.133.170   8090:32023/TCP   17m

NAME                          READY   UP-TO-DATE   AVAILABLE   AGE
deployment.apps/postgresdb    1/1     1            1           30m
deployment.apps/todobackend   3/3     3            3           29m
deployment.apps/todoui        1/1     1            1           31m

NAME                                     DESIRED   CURRENT   READY   AGE
replicaset.apps/postgresdb-6c9bd7c5d8    1         1         1       30m
replicaset.apps/todobackend-67fd9b6c69   3         3         3       22m
replicaset.apps/todobackend-764f9f96bc   0         0         0       29m
replicaset.apps/todoui-6767f8695c        1         1         1       22m
replicaset.apps/todoui-6ff66fdfc9        0         0         0       31m
The services are not affected, but the ReplicaSet has a new Desired state, this is also reflected in the Deployment object and two new Pods are being created. Note that they still have the same id for the ReplicaSet part, but different in the Pod part, and by way of the labels all todobackend Pods now will be addressed by the todobackend service:
graph LR;
    A{Internet} -->|LoadBalancer:8090| B
    subgraph Kubernetes
        subgraph s1["Deployment -> Pod"]
            B(todoui)
        end
        subgraph Deployment
            C(todobackend)
            B -->|ClusterIP:8080| C
            C --> D[Pod 1]
            C --> E[Pod 2]
            C --> F[Pod 3]
        end
        subgraph s2["Deployment -> Pod"]
            G(postgresdb)
            D -->|ClusterIP:5432| G
            E -->|ClusterIP:5432| G
            F -->|ClusterIP:5432| G
        end
    end
In the while loop this becomes visible after a while, too:
todobackend-67fd9b6c69-rlrv2 Hallo, Welt !
todobackend-67fd9b6c69-rlrv2 Hallo, Welt !
todobackend-67fd9b6c69-qqs7p Hallo, Welt !
todobackend-67fd9b6c69-qqs7p Hallo, Welt !
todobackend-67fd9b6c69-zm622 Hallo, Welt !
todobackend-67fd9b6c69-rlrv2 Hallo, Welt !
todobackend-67fd9b6c69-qqs7p Hallo, Welt !
todobackend-67fd9b6c69-qqs7p Hallo, Welt !
Once all 3 instances have started you will see that the last part of the id alternates and the load balancer distributes the load over all available instances. However, until then you might see several connection failures when a request was sent to an application instance which was not yet fully ready to serve requests. We will get to how to handle that later on.
Exercise - Autoscale the instances of the application
By the way, we don’t necessarily need to manually scale our Deployments, but rather Kubernetes can help us with that. We
need to have a metrics server gathering basic cluster metrics installed, but luckily we already have one predefined,
cf. kubectl top pod. And if we don’t yet have one we can install one as outlined in
Observability - Metrics
. Either way, we can now put our metrics server to good use
for some tests on the todoui frontend:
kubectl autoscale deployment todoui --cpu 50% --min 1 --max 5
Milestone: K8S/RUNTIME/TODOUI-AUTOSCALE
This will create a Horizontal Pod Autoscaler (HPA) which we can now check:
kubectl get hpa
NAME     REFERENCE           TARGETS         MINPODS   MAXPODS   REPLICAS   AGE
todoui   Deployment/todoui   <unknown>/50%   1         5         1          3s
So, we tell the HPA to keep the average CPU load over all replicas of the Deployment at 50% of the maximal resources.
Of course, putting this todoui under stress normally would be quite a challenge as it isn’t doing all too much work anyways, which is why we provide a specific “/stress” endpoint which - each time when triggered - causes the UI to calculate the sum of 100 million individual calls of getting the current time milliseconds. A senseless but CPU-intensive task, so let’s see how our HPA deals with this.
And to let the HPA ramp up quicker - for demonstration purposes - let’s first restrict the CPU resources allocatable to the todoui container(s):
kubectl patch deployment todoui --patch '{"spec":{"template":{"spec":{"containers":[{"name":"todoui","resources":{"limits":{"cpu":"500m"},"requests":{"cpu":"200m"}}}]}}}}'
I.e. tell Kubernetes that this Deployment is expected to consume 200 milliCores, but allow up to 500 milliCores.
Milestone: K8S/RUNTIME/TODOUI-PATCH
To visualize the HPA behavior a little better open two new terminal windows. Within one of these windows get the
external IP address of the UI via kubectl get services todoui -o jsonpath='{.status.loadBalancer.ingress[].ip}'; echo
and then run a constant while loop to stress the application:
while true; do time curl http://<EXTERNAL-IP>:8090/stress; done
And in the other window keep track of the HPA status:
kubectl get hpa todoui --watch
Also feel free to track the Pods to see on which cluster nodes they will be placed, so in yet another window execute:
kubectl get pods -o wide --watch
And if you like you can watch the UI stressing in the original window by checking the logs of the first todoui Pod:
kubectl logs --follow todoui-<ReplicaSetId>-<PodId>
Remember, you can use TAB-completion for this. Just try pressing TAB after the todoui- part and see how far it autocompletes. If it doesn’t complete fully, this means there are several options available, so just press TAB repeatedly to list them, possibly entering further characters to make the autocompletion find a unique match.
Tip
You might think you could alternatively just follow the logs of all todoui Pods via
kubectl logs --follow --prefix deployment/todoui
However, this flag implies a certain quirk. Just try it and see whether this works for you as well, and then you might fall back to using a label selector as in
kubectl logs --follow --prefix -l tier=frontend
Let this run a bit and watch how - after a short ramp-up time - the HPA scales up the number of replica Pods in the todoui Deployment and - once you Ctrl+C the curl loop - eventually scales them down again:
NAME     REFERENCE           TARGETS         MINPODS   MAXPODS   REPLICAS   AGE
todoui   Deployment/todoui   <unknown>/50%   1         5         1          13m
todoui   Deployment/todoui   78%/50%         1         5         1          14m
todoui   Deployment/todoui   78%/50%         1         5         2          14m
todoui   Deployment/todoui   61%/50%         1         5         2          15m
todoui   Deployment/todoui   20%/50%         1         5         2          16m
todoui   Deployment/todoui   123%/50%        1         5         2          17m
todoui   Deployment/todoui   123%/50%        1         5         4          17m
todoui   Deployment/todoui   123%/50%        1         5         5          17m
todoui   Deployment/todoui   133%/50%        1         5         5          18m
todoui   Deployment/todoui   50%/50%         1         5         5          19m
todoui   Deployment/todoui   49%/50%         1         5         5          20m
todoui   Deployment/todoui   44%/50%         1         5         5          21m
todoui   Deployment/todoui   59%/50%         1         5         5          22m
todoui   Deployment/todoui   5%/50%          1         5         5          23m
todoui   Deployment/todoui   0%/50%          1         5         5          24m
todoui   Deployment/todoui   1%/50%          1         5         5          25m
todoui   Deployment/todoui   0%/50%          1         5         5          26m
todoui   Deployment/todoui   0%/50%          1         5         5          27m
todoui   Deployment/todoui   0%/50%          1         5         5          28m
todoui   Deployment/todoui   0%/50%          1         5         1          28m
So, in the meantime this might look like this:
graph LR;
    A{Internet} -->|LoadBalancer:8090| B
    subgraph Kubernetes
        subgraph s1["Deployment"]
            B(todoui)
            B --> C[Pod 1]
            B --> D[Pod 2]
        end
        subgraph s2["Deployment"]
            E(todobackend)
            C -->|ClusterIP:8080| E
            D -->|ClusterIP:8080| E
            E --> F[Pod 1]
            E --> G[Pod 2]
            E --> H[Pod 3]
        end
        subgraph s3["Deployment -> Pod"]
            I(postgresdb)
            F -->|ClusterIP:5432| I
            G -->|ClusterIP:5432| I
            H -->|ClusterIP:5432| I
        end
    end
At the end, when finally the number of replicas is down to 1 again you can Ctrl+C the hpa watch and the log follower as well and close the additional windows before returning to our backend application. And the HPA we will keep for now.
Exercise - Isolation of broken instances
After this brief interlude with the todoui now back to the backend. If you kill the backend application again like before
curl <EXTERNAL-IP>:<PORT>/fail
you might notice that Kubernetes will try to isolate the broken instances, but there are still unwanted observations in the output (and you might have seen similar messages during the previous autoscaling exercise):
todobackend-67fd9b6c69-rlrv2 Hallo, Welt !
curl: (7) Failed to connect to 20.82.83.63 port 8080: Connection refused

curl: (7) Failed to connect to 20.82.83.63 port 8080: Connection refused

todobackend-67fd9b6c69-zm622 Hallo, Welt !
todobackend-67fd9b6c69-zm622 Hallo, Welt !
This will level out after a while. Why do you think this happens in the first place?
Exercise - Adding a readiness check
In order to make Kubernetes aware what the application is actually doing or better when it is ready to accept incoming traffic, there is the concept of a so called readiness check.
Edit the deployment yaml file and add the following section:
nano todobackend.yaml
This must go under the section containers (place below “todobackend” name):
        readinessProbe:
          httpGet:
            path: /hello
            port: 8080
          initialDelaySeconds: 1
          timeoutSeconds: 1
          periodSeconds: 1
          failureThreshold: 1
Where it should look embedded like this:
    spec:
      containers:
      - name: todobackend
        readinessProbe:
          httpGet:
            path: /hello
            port: 8080
          initialDelaySeconds: 1
          timeoutSeconds: 1
          periodSeconds: 1
          failureThreshold: 1
        env:
Hint: See image and diagram below - they illustrate the flow of these probe intervals by showing some possible event triggers:
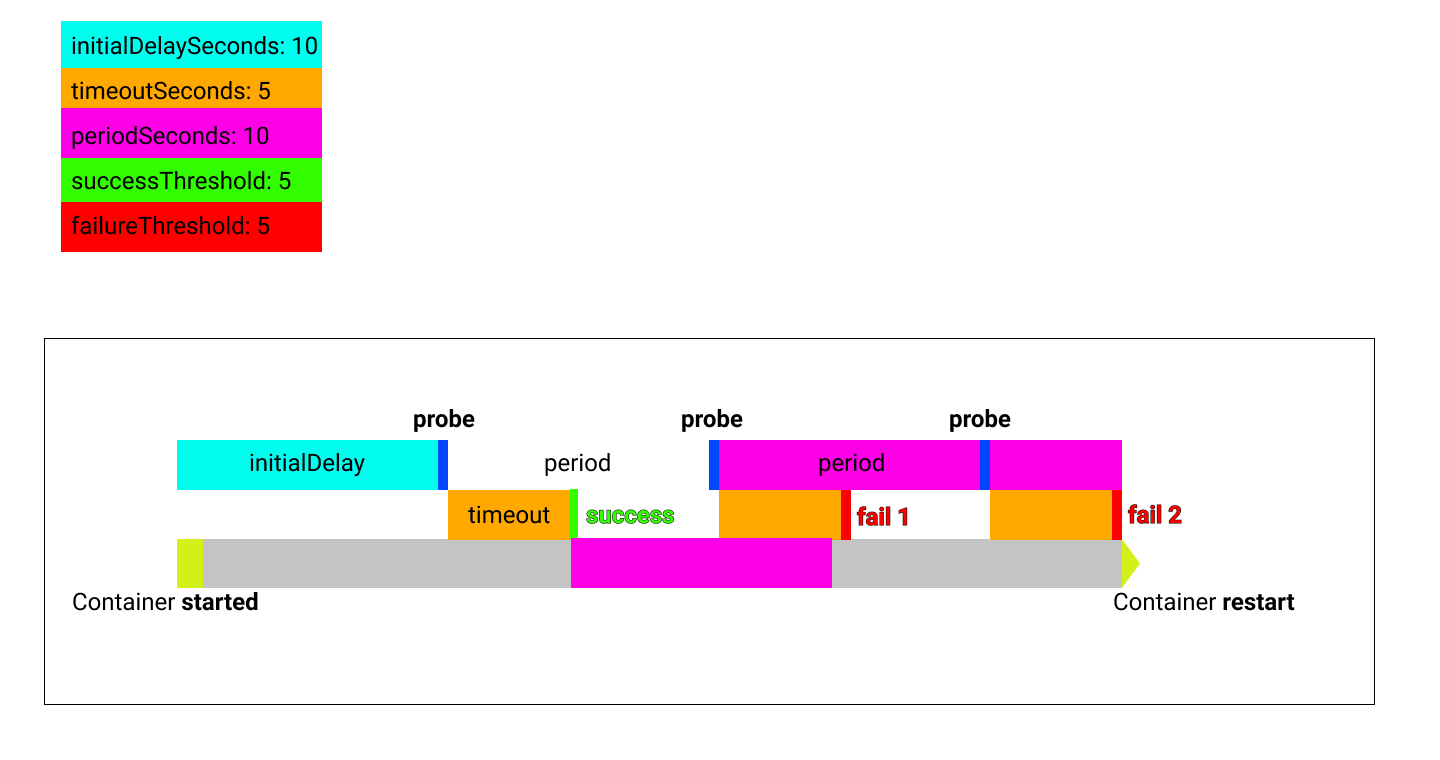
sequenceDiagram
    participant K as Kubernetes
    participant P as Pod
    note over K: initialDelaySeconds
    loop periodSeconds
        K->>P: httpGet :8080/hello
        note over K,P: timeoutSeconds
        opt reply
        %% empty reply from P to K, so don't drop the trailing space in the next line!
        P-->>K:
        end
        alt success
            alt >= successThreshold
                note over K,P: Ready
            else < successThreshold
                note over K,P: Not Ready
            end
        else failure
            alt >= failureThreshold
                note over K,P: Not Ready
            else < failureThreshold
                note over K,P: Ready
            end
        end
    end
Also change the scaling to the desired 3 instances:
kind: Deployment
metadata:
  name: todobackend
  labels:
    app: todobackend
spec:
  replicas: 3
Save the file, inspect the changes, and re-apply:
kubectl diff -f todobackend.yaml
kubectl apply -f todobackend.yaml
Milestone: K8S/RUNTIME/TODOBACKEND-READINESS
This will trigger a couple of things.
First there will be a new ReplicaSet under the same Deployment:
NAME                                     DESIRED   CURRENT   READY   AGE
replicaset.apps/postgresdb-6c9bd7c5d8    1         1         1       37m
replicaset.apps/todobackend-5d55554df8   1         1         0       6s
replicaset.apps/todobackend-67fd9b6c69   3         3         3       30m
replicaset.apps/todobackend-764f9f96bc   0         0         0       37m
replicaset.apps/todoui-6767f8695c        0         0         0       30m
replicaset.apps/todoui-6ff66fdfc9        0         0         0       39m
replicaset.apps/todoui-ffdd8c6f5         5         5         5       2m15s
The Pods of the old ReplicaSet will be taken down whereas the new ones will be coming up. Note the middle part of the id is now changing:
NAME                               READY   STATUS        RESTARTS      AGE
pod/postgresdb-6c9bd7c5d8-kd4lw    1/1     Running       0             37m
pod/todobackend-5d55554df8-25mz5   1/1     Running       0             58s
pod/todobackend-5d55554df8-rw2sz   0/1     Running       0             38s
pod/todobackend-5d55554df8-zt9hs   1/1     Running       0             48s
pod/todobackend-67fd9b6c69-qqs7p   1/1     Terminating   1 (11m ago)   17m
pod/todoui-ffdd8c6f5-g8qzh         1/1     Running       0             29s
In the while loop you will also see a transition between the two:
todobackend-67fd9b6c69-qqs7p Hallo, Welt !
todobackend-67fd9b6c69-rlrv2 Hallo, Welt !
todobackend-67fd9b6c69-rlrv2 Hallo, Welt !
todobackend-5d55554df8-rw2sz Hallo, Welt !
todobackend-5d55554df8-rw2sz Hallo, Welt !
todobackend-5d55554df8-rw2sz Hallo, Welt !
So to sum it up, for Kubernetes this config change was like deploying a new version of the app and starting the transition between the two.
Scale back to 3 instances in case you forgot to change in the file:
kubectl scale deployment todobackend --replicas 3
And wait quickly for them to become healthy. This might take about a minute depending on your machine power.
Once it looks like this:
NAME                               READY   STATUS    RESTARTS   AGE
pod/postgresdb-6c9bd7c5d8-kd4lw    1/1     Running   0          42m
pod/todobackend-5d55554df8-25mz5   1/1     Running   0          4m21s
pod/todobackend-5d55554df8-rw2sz   1/1     Running   0          4m1s
pod/todobackend-5d55554df8-zt9hs   1/1     Running   0          4m11s
If you kill the application again like before
curl <EXTERNAL-IP>:<PORT>/fail
You will see that the STATUS of the Pod will go into “Running” again, but it takes much longer for it to be “READY”
NAME                               READY   STATUS    RESTARTS   AGE
pod/postgresdb-6c9bd7c5d8-kd4lw    1/1     Running   0          42m
pod/todobackend-5d55554df8-25mz5   1/1     Running   0          4m56s
pod/todobackend-5d55554df8-rw2sz   1/1     Running   0          4m36s
pod/todobackend-5d55554df8-zt9hs   0/1     Running   0          4m46s
In the while loop output you might see a quick break for the killed instance, if at all. However after that there will be only 2 instances addressed.
todobackend-5d55554df8-rw2sz Hallo, Welt !
curl: (7) Failed to connect to 20.82.83.63 port 8080: Connection refused

todobackend-5d55554df8-rw2sz Hallo, Welt !
todobackend-5d55554df8-25mz5 Hallo, Welt !
todobackend-5d55554df8-rw2sz Hallo, Welt !
todobackend-5d55554df8-25mz5 Hallo, Welt !
todobackend-5d55554df8-rw2sz Hallo, Welt !
And the 3rd one will be only reintegrated once it is healthy:
todobackend-5d55554df8-25mz5 Hallo, Welt !
todobackend-5d55554df8-rw2sz Hallo, Welt !
todobackend-5d55554df8-rw2sz Hallo, Welt !
todobackend-5d55554df8-zt9hs Hallo, Welt !
No interruption (or hardly any) of the service any more!
Exercise - Deploy new version
The final step is to simulate a patch of the buggy application. So let’s assume operations has found the error and development has fixed and provided a new image with the same name, but v0.2.
To update this time edit the live deployment instead of changing and re-applying the file:
kubectl edit deployment todobackend
Tip
Don’t like the default editor? Override via KUBE_EDITOR="vim" kubectl edit deployment todobackend.
Scroll until you find the image information and update it to v0.2:
        env:
        - name: SPRING_PROFILES_ACTIVE
          value: prod
        - name: POSTGRES_HOST
          value: postgresdb
        image: novatec/technologyconsulting-containerexerciseapp-todobackend:v0.2
      restartPolicy: Always
After saving the effect will directly take place.
Alternatively, instead of editing interactively, you could just tell kubectl to update the deployment image:
kubectl set image deployment/todobackend todobackend=novatec/technologyconsulting-containerexerciseapp-todobackend:v0.2
Milestone: K8S/RUNTIME/TODOBACKEND-NEW
Question: what would happen if - after the preceding change - you were to reapply the todobackend.yaml file as it is?
Either way, a new version and hence a new ReplicaSet will appear:
NAME                                     DESIRED   CURRENT   READY   AGE
replicaset.apps/postgresdb-6c9bd7c5d8    1         1         1       45m
replicaset.apps/todobackend-545f9cb69    1         1         0       6s
replicaset.apps/todobackend-5d55554df8   3         3         3       7m30s
replicaset.apps/todobackend-67fd9b6c69   0         0         0       37m
replicaset.apps/todobackend-764f9f96bc   0         0         0       45m
replicaset.apps/todoui-6767f8695c        0         0         0       37m
replicaset.apps/todoui-6ff66fdfc9        0         0         0       46m
replicaset.apps/todoui-ffdd8c6f5         1         1         1       9m39s
A new set of Pods will be deployed while the old ones are going away:
NAME                               READY   STATUS    RESTARTS        AGE
pod/postgresdb-6c9bd7c5d8-kd4lw    1/1     Running   0               45m
pod/todobackend-545f9cb69-qvkjq    0/1     Running   0               6s
pod/todobackend-5d55554df8-25mz5   1/1     Running   0               7m30s
pod/todobackend-5d55554df8-rw2sz   1/1     Running   0               7m10s
pod/todobackend-5d55554df8-zt9hs   1/1     Running   1 (2m30s ago)   7m20s
pod/todoui-ffdd8c6f5-hhhzf         1/1     Running   0               8m24s
If the ReadinessProbe was applied correctly, the transition should happen without any downtime:
todobackend-545f9cb69-5mzh2 Hallo, Welt !
todobackend-545f9cb69-qvkjq Hallo, Welt !
todobackend-545f9cb69-qvkjq Hallo, Welt !
todobackend-545f9cb69-mrp9c Hallo, Welt !
todobackend-545f9cb69-5mzh2 Hallo, Welt !
todobackend-545f9cb69-mrp9c Hallo, Welt !
todobackend-545f9cb69-qvkjq Hallo, Welt !
Well, to be honest, it might happen that a connection is currently in progress and it has already been routed to a specific todobackend Pod. If then right at that moment this specific Pod gets terminated, e.g. during a Rolling Upgrade, then we will still experience a connection loss. Kubernetes by itself will not trigger a connection retry in such a case, but there exist means to achieve that as we will see later on .
Either way, a curl to the failing endpoint
curl <EXTERNAL-IP>:<PORT>/fail; echo
should now only return:
fixed!Congrats! You’ve done well!
Exercise - Database crash
Now let’s imagine another failure scenario, the crash of the database. It is very easy to simulate by simply deleting the postgres db pod.
kubectl delete pod postgresdb-<ReplicaSetId>-<PodId>
Remember you can use TAB-completion for this, e.g. kubectl delete pod postg<TAB>.
Kubernetes will immediately try to restart a new one.
NAME                               READY   STATUS              RESTARTS   AGE
pod/postgresdb-6c9bd7c5d8-fdtx4    0/1     ContainerCreating   0          1s
pod/postgresdb-6c9bd7c5d8-kd4lw    1/1     Terminating         0          45m
However this will create a blank pod with uninitialized database. The application of todobackend will most likely run into an error here as it will try to access the new database backend just like the old one.
Try to execute the following command for the todobackend again:
curl <EXTERNAL-IP>:<PORT>/todos/; echo
curl 20.82.83.63:8080/todos/; echo
{"timestamp":"2023-12-01T11:23:36.281+0000","status":500,"error":"Internal Server Error","message":"could not extract ResultSet; SQL [n/a]; nested exception is org.hibernate.exception.SQLGrammarException: could not extract ResultSet","path":"/todos/"}
This call returns an unhealthy return code, however the app itself is still alive. Invoke the /hello endpoint to validate:
curl <EXTERNAL-IP>:<PORT>/hello; echo
which will still result in something like:
todobackend-545f9cb69-qvkjq Hallo, Welt !This means from a Kubernetes readiness check perspective the app is OK, but from an application level perspective it is not operational. In this case the pod should be restarted to re-initialize the database connection. Kubernetes provides a means called liveness check to address exactly this with a very similar syntax.
        livenessProbe:
          httpGet:
            path: /todos/
            port: 8080
          initialDelaySeconds: 30
          timeoutSeconds: 1
          periodSeconds: 10
          failureThreshold: 3
Edit the deployment yaml file again and place it below the readinessProbe:
nano todobackend.yaml
    spec:
      containers:
        - name: todobackend
          readinessProbe:
            httpGet:
              path: /hello
              port: 8080
            initialDelaySeconds: 1
            timeoutSeconds: 1
            periodSeconds: 1
            failureThreshold: 1
          livenessProbe:
            httpGet:
              path: /todos/
              port: 8080
            initialDelaySeconds: 30
            timeoutSeconds: 1
            periodSeconds: 10
            failureThreshold: 3
          env:
In this case the initialDelaySeconds is set to 30 seconds to take effect only when we can be sure that the application
should be up. After that it checks every 10 seconds if this endpoint is up and only triggers if 3 attempts in a row are
failing.
Save the file, inspect the changes, and re-apply it:
kubectl diff -f todobackend.yaml
kubectl apply -f todobackend.yaml
Milestone: K8S/RUNTIME/TODOBACKEND-LIVENESS
It will result again in the creation of a new ReplicaSet and the same amount of Pods underneath.
Invoking curl again will result in a healthy todobackend application.
curl 20.82.83.63:8080/todos/; echowhich should just yield
[]However this indicates that the database has lost its data. This problem will be addressed in the section Storage , and incidentally this is why we skipped adding the tier: database label in a previous exercise, so as to not point out this problem too early.
The database will also lose its data even when we do not fully remove the Pod but gracefully shut down the database, e.g. when issuing
kubectl exec deployment/postgresdb -- su - postgres -c '/usr/lib/postgresql/12/bin/pg_ctl stop -D /var/lib/postgresql/data'
Why, when the Pod persists? Oh, and do you find anything problematic in that sample command?
Repeating the database failure once more now will show the changes taking effect. Before killing the database again
observe the log files of the todobackend application. Use the -f flag (i.e. --follow) to keep following the logs.
kubectl logs -f todobackend-<ReplicaSetId>-<PodId>
Tip
Or you might think you could alternatively just follow the logs of all todobackend Pods via
kubectl logs --follow --prefix deployment/todobackend
However, this flag implies a certain quirk. Just try it and see whether this works for you as well, and then you might fall back to using a label selector as in
kubectl logs --follow --prefix -l tier=backend
From a separate CLI window delete the database pod.
kubectl delete pod postgresdb-<ReplicaSetId>-<PodId>
Observe the behavior in the watch command and the log files.
It will take a few seconds (30 at most) until the liveness probe will execute first time. The log files will return a long stack trace info containing information like:
#2023-12-01 12:28:46.908  WARN 1 --- [io-8080-exec-10] o.h.engine.jdbc.spi.SqlExceptionHelper   : SQL Error: 0, SQLState: 42P01
2023-12-01 12:28:46.908 ERROR 1 --- [io-8080-exec-10] o.h.engine.jdbc.spi.SqlExceptionHelper   : ERROR: relation "todo" does not exist
  Position: 37
It will pause and then re-occur for 2 more times. The failure threshold is set to 3 in the probe, so after 3 unsuccessful tests, the pod will terminate and restart. For a short second you can observe this in the pod overview:
todobackend-5489d6c5c-575k6 1/1 Running 1 (9s ago) 4m39sThe logs will interrupt at this point as the pod has terminated and been restarted. Looking into the logs again now,
i.e. reexecuting the kubectl logs ... command from above, will show a starting application.
In case you did not catch all of the things happening above just kill the database pod over again. It should be a reproducible scenario :)
Thank you!