Metrics
We will first focus on node-level metrics and container metrics here, to show what can be easily be achieved in our infrastructure. Of course, it is possible to apply instrumentation to our applications in order to also collect application metrics or dependent service metrics (e.g. using Novatec’s inspectIT Ocelot ), but this can quickly become arbitrarily complicated and will be left for another time.
It is convenient to collect the various metrics in a time-series database such as Prometheus or InfluxDB running in the cluster, or to export them to one of the commercial solution providers such as New Relic or DataDog . In our case, we are using Prometheus , a graduate project of the Cloud Native Computing Foundation , which has already been set up in our cluster (yes, both Linkerd and Istio have their own integrated Prometheus instance, but we are using our own here to show how to set up metrics handling from scratch).
Prometheus is a pull-based system. It periodically scrapes metrics from configured locations, such as those generated by cAdvisor or kube-state-metrics . kube-state-metrics is a service that collects metrics from the Kubernetes API server and makes them available to Prometheus (or a scraper compatible with a Prometheus client endpoint). For system metrics, we use Node exporter , which is a Prometheus system metrics exporter. Prometheus supports floating point data, but not string data, so it is good for system metrics, but not logs.
The Kubernetes Metrics Server is a cluster-wide aggregator of resource usage data that can be used as a metrics server if no such metrics server already exists in a cluster.
Prometheus and its dependent components are installed using the Helm chart kube-prometheus-stack . The dependent Helm charts are kube-state-metrics , prometheus-node-exporter and Grafana . It is a collection of Kubernetes manifests, Grafana dashboards, and Prometheus rules combined with documentation and scripts to provide easy to operate end-to-end Kubernetes cluster monitoring with Prometheus using the Prometheus Operator.
Exercise - Explore Prometheus
Again let’s first take a look which Custom Resource Definitions (CRD) the Operator provides:
kubectl get crd | grep -e '^NAME' -e 'monitoring\.coreos\.com'
NAME                                               CREATED AT
alertmanagerconfigs.monitoring.coreos.com          2025-03-20T09:37:48Z
alertmanagers.monitoring.coreos.com                2025-03-20T09:37:49Z
podmonitors.monitoring.coreos.com                  2025-03-20T09:37:49Z
probes.monitoring.coreos.com                       2025-03-20T09:37:50Z
prometheusagents.monitoring.coreos.com             2025-03-20T09:37:50Z
prometheuses.monitoring.coreos.com                 2025-03-20T09:37:51Z
prometheusrules.monitoring.coreos.com              2025-03-20T09:37:51Z
scrapeconfigs.monitoring.coreos.com                2025-03-20T09:37:51Z
servicemonitors.monitoring.coreos.com              2025-03-20T09:37:52Z
thanosrulers.monitoring.coreos.com                 2025-03-20T09:37:52Z
Those have been used to create some resources in the monitoring namespace:
kubectl get pods --namespace monitoring
NAME                                                              READY   STATUS    RESTARTS   AGE
alertmanager-monitoring-kube-prometheus-0                         2/2     Running   0          3h19m
monitoring-grafana-778ffcc497-ktlmp                               3/3     Running   0          145m
monitoring-kube-prometheus-operator-56785d9c4f-gm2k5              1/1     Running   0          3h19m
monitoring-kube-state-metrics-7cbc8b88c4-dpkpc                    1/1     Running   0          3h19m
monitoring-probes-prometheus-blackbox-exporter-79d6cc5b96-hntvn   1/1     Running   0          3h18m
monitoring-prometheus-node-exporter-tfjfz                         1/1     Running   0          3h19m
prometheus-monitoring-kube-prometheus-0                           2/2     Running   0          3h19m
So we already see Pods deployed as part of a Deployment, part of a DaemonSet, or part of a StatefulSet. And while we could continue investigating what has been set up using
kubectl get all --namespace monitoring
followed by
kubectl describe ...,
let’s instead just jump right into querying Prometheus.
Exercise - Access monitoring data
Tip
If you just want to access the monitoring data using a web interface then please jump forward to the web interface exercise . Here we start accessing data using the raw API now.
For example, what were the total CPU usage seconds consumed by our todoui container over the last 5 minutes, with 1 minute sample resolution:
Tip
Before executing make sure the variable $NAMESPACE is still available from Ingress Controller - Namespaces .
export NAMESPACE=$(kubectl config view –minify –output ‘jsonpath={..namespace}’); echo $NAMESPACE
curl --silent \
    --data-urlencode "query=container_cpu_usage_seconds_total{namespace='$NAMESPACE',container='todoui'}" \
    --data-urlencode "start=$(date --utc +%Y-%m-%dT%H:%M:%S.%N --date '5 minutes ago')Z" \
    --data-urlencode "end=$(date --utc +%Y-%m-%dT%H:%M:%S.%N)Z" \
    --data-urlencode 'step=1m' \
    https://zwtj1.prometheus.cloudtrainings.online/api/v1/query_range |
    jq '.data.result[].values'
which should yield something along the lines of (i.e. timestamp and value)
[
  [
    1742482934.026, # TIMESTAMP
    "52.738517"     # CPU_USAGE_SECONDS
  ],
  [
    1742482994.026,
    "52.87488"
  ],
  [
    1742483054.026,
    "52.962213"
  ],
  [
    1742483114.026,
    "53.038872"
  ],
  [
    1742483174.026,
    "53.112458"
  ],
  [
    1742483234.026,
    "53.193965"
  ]
]
And what was the total CPU usage seconds consumed by our todoui container at the time of the last check:
curl --silent \
    --data-urlencode "query=container_cpu_usage_seconds_total{namespace='$NAMESPACE',container='todoui'}" \
    https://zwtj1.prometheus.cloudtrainings.online/api/v1/query |
    jq '.data.result[].value'
which should yield something along the lines of (i.e. timestamp and value)
[
  1742483582.912,
  "53.662075"
]
Feel free to apply some stress to the todoui and try again, watching what might change.
Which alerting rules does Prometheus have predefined? E.g. a rule to indicate whether any container has been waiting too long to start, indicating it cannot be scheduled which might hint at cluster resource shortage or at problems while obtaining its container image:
curl --silent https://zwtj1.prometheus.cloudtrainings.online/api/v1/rules |
    jq '.data.groups[] | select(.name=="kubernetes-apps").rules[] | select(.name=="KubeContainerWaiting")'
{
"state": "inactive",
"name": "KubeContainerWaiting",
"query": "kube_pod_container_status_waiting_reason{job=\"kube-state-metrics\",namespace=~\".*\",reason!=\"CrashLoopBackOff\"} > 0",
"duration": 3600,
"keepFiringFor": 0,
"labels": {
"severity": "warning"
},
"annotations": {
"description": "pod/{{ $labels.pod }} in namespace {{ $labels.namespace }} on container {{ $labels.container}} has been in waiting state for longer than 1 hour. (reason: \"{{ $labels.reason }}\") on cluster {{ $labels.cluster }}.",
"runbook_url": "https://runbooks.prometheus-operator.dev/runbooks/kubernetes/kubecontainerwaiting",
"summary": "Pod container waiting longer than 1 hour"
},
"alerts": [],
"health": "ok",
"evaluationTime": 0.0000833,
"lastEvaluation": "2025-03-20T15:14:18.609279843Z",
"type": "alerting"
}Once such an alerting rule starts firing this could look like this, here shown when a cluster was overcommitted so most probably there won’t be any output when you try yourself:
curl --silent https://zwtj1.prometheus.cloudtrainings.online/api/v1/alerts |
    jq '.data.alerts[] | select(.labels.alertname=="KubeCPUOvercommit")'
{
"labels": {
"alertname": "KubeCPUOvercommit",
"severity": "warning"
},
"annotations": {
"message": "Cluster has overcommitted CPU resource requests for Pods and cannot tolerate node failure.",
"runbook_url": "https://github.com/kubernetes-monitoring/kubernetes-mixin/tree/master/runbook.md#alert-name-kubecpuovercommit"
},
"state": "firing",
"activeAt": "2020-08-17T09:18:47.55260138Z",
"value": "8.91e-01"
}However, all in all let’s not forget one important thing:
curl --silent https://zwtj1.prometheus.cloudtrainings.online/api/v1/status/flags |
jq '.data."storage.tsdb.retention.time"'"10d"Yes, in this setup the data stored in the Prometheus Time-Series-DataBase (TSDB) will only be retained for a ten days. How does this comply with analyzing performance trends over time?
Well, per default Prometheus will poll data once every 15-30 seconds, dependent on the target, and even in a small Kubernetes cluster there are easily thousands of data series to retrieve, each with potentially multi-dimensional data, with a bigger cluster easily having several millions of them, so storage capacity and manageability quickly becomes an issue. For that reason you’d normally use Prometheus to only retain the most recent data in high granularity, but downsample all important data for collection and long-term retention by a federated Prometheus cluster which is then placed outside of the Kubernetes cluster.
Still, for our purposes here, or for any near-time metrics observation, one day retention period will suffice.
Oh, and by the way, Prometheus is a nice example for the multi-container Pod context, utilizing the sidecar pattern for reloading an application once configuration data mapped into the container changes:
kubectl top pod --namespace monitoring --containers --selector 'app.kubernetes.io/name in (prometheus, alertmanager)'
POD                                         NAME              CPU(cores)   MEMORY(bytes)
alertmanager-monitoring-kube-prometheus-0   alertmanager      1m           27Mi
alertmanager-monitoring-kube-prometheus-0   config-reloader   1m           23Mi
prometheus-monitoring-kube-prometheus-0     config-reloader   1m           27Mi
prometheus-monitoring-kube-prometheus-0     prometheus        25m          334Mi
Exercise - Access monitoring data via web interface
Again, we humans might prefer a different interface for analyzing our metrics on the fly. For this purpose, we can use the various web interfaces:
- Prometheus (for accessing the raw monitoring configuration and data)
- Grafana
(for graphing the monitoring data, username: “admin”, password: “zwtj1”)
- Compute Resources - Cluster
- Networking - Cluster
- USE Method - Cluster
- USE Method - Node
- and many more allowing to further drill down into the data …
- Alertmanager (for managing alerting based on the monitoring data)
Then you will be able to access these through your local browser and you should see the interfaces like in the following sample pictures:
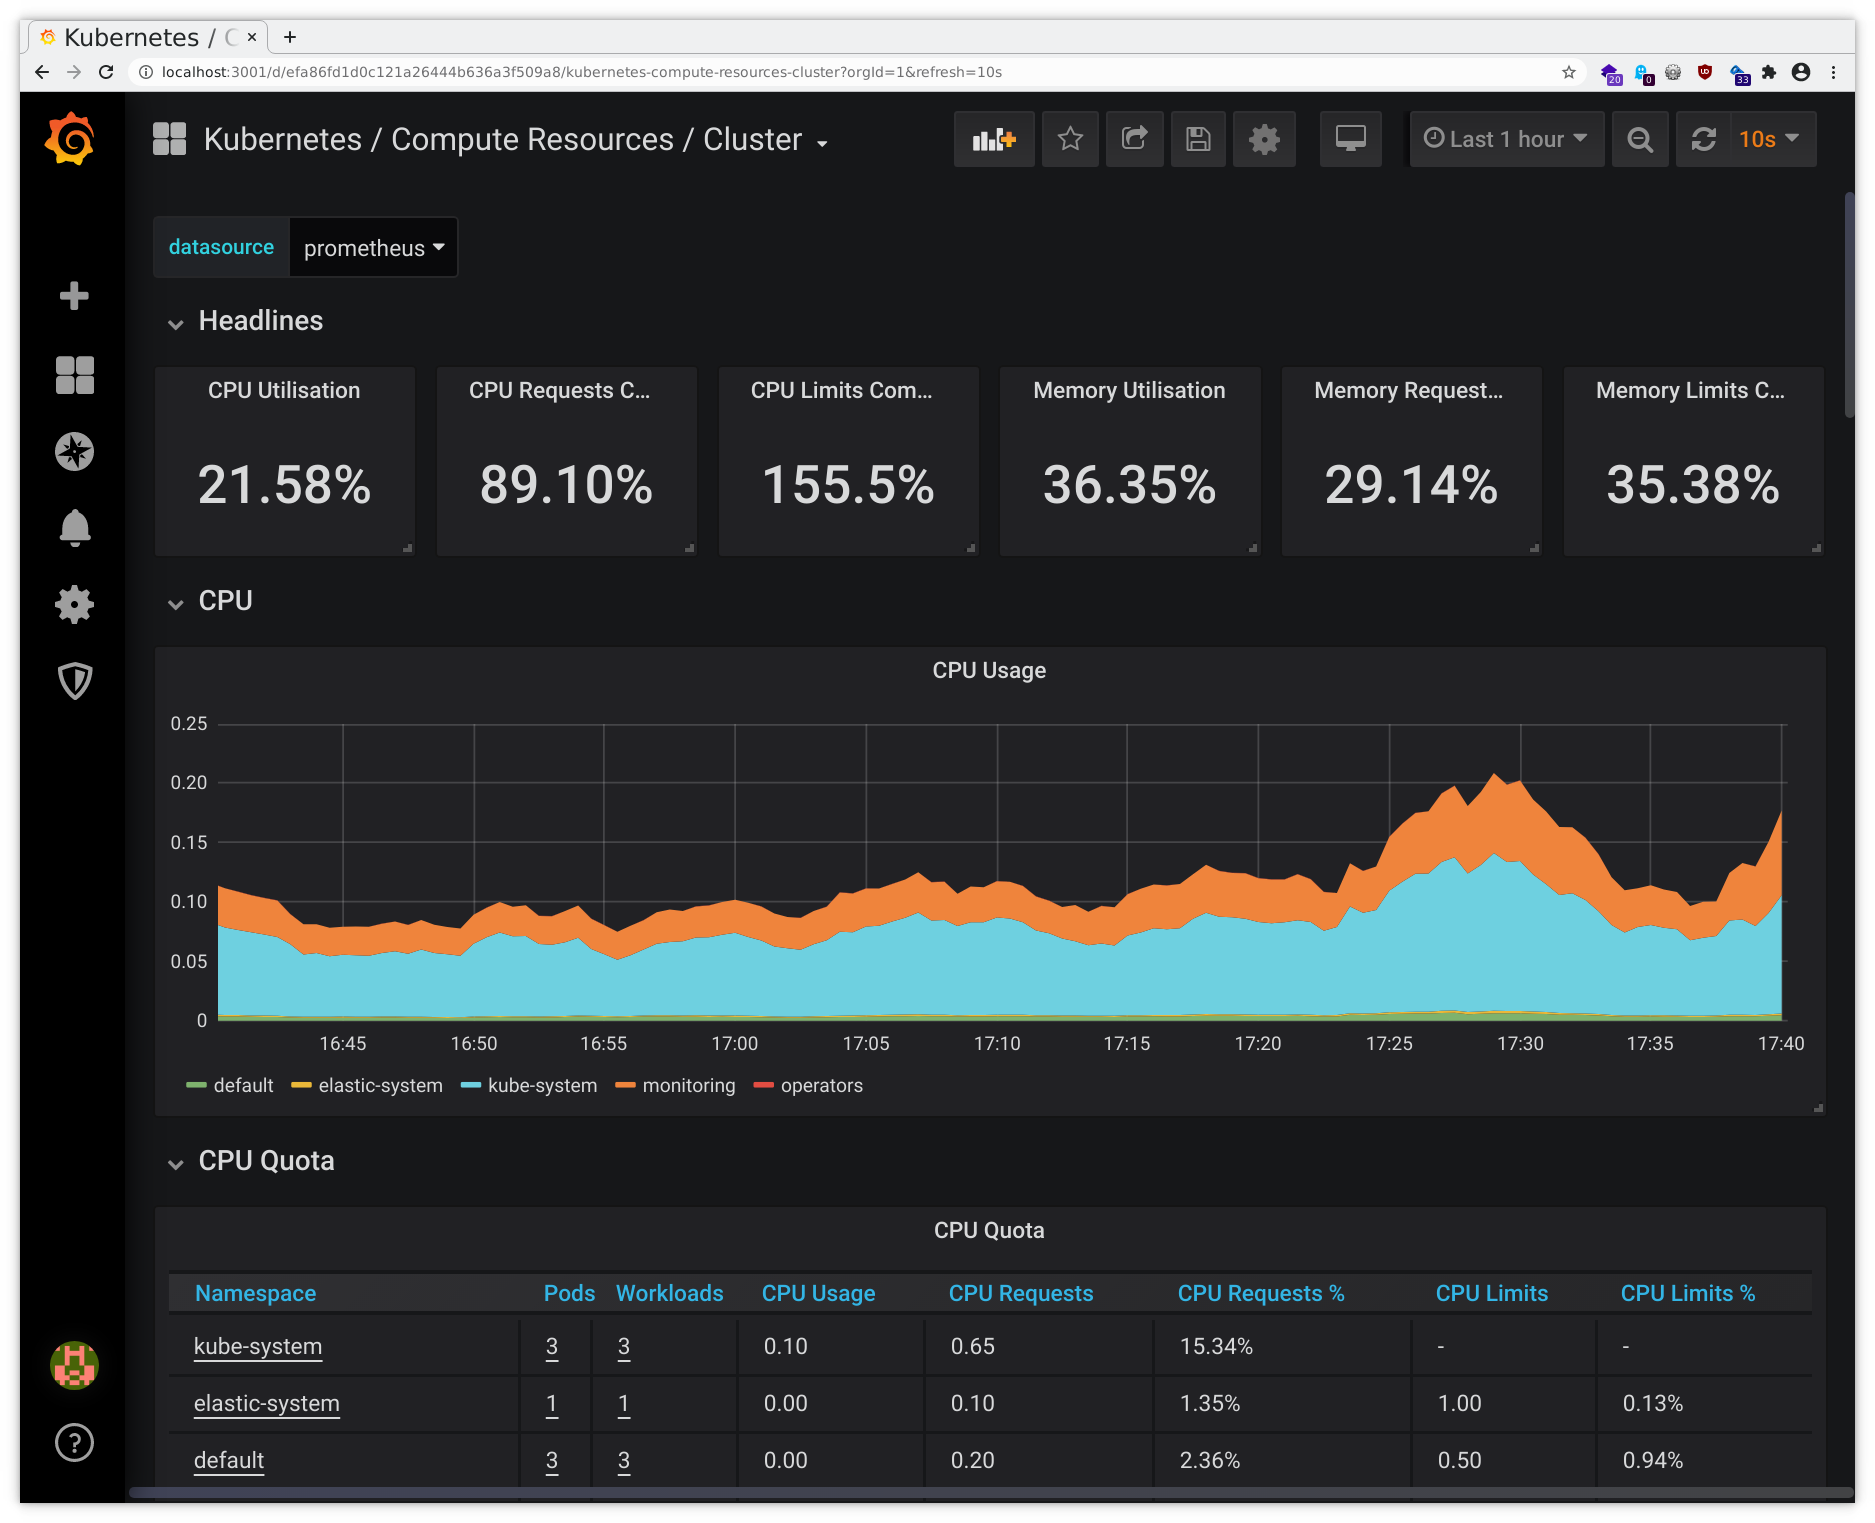
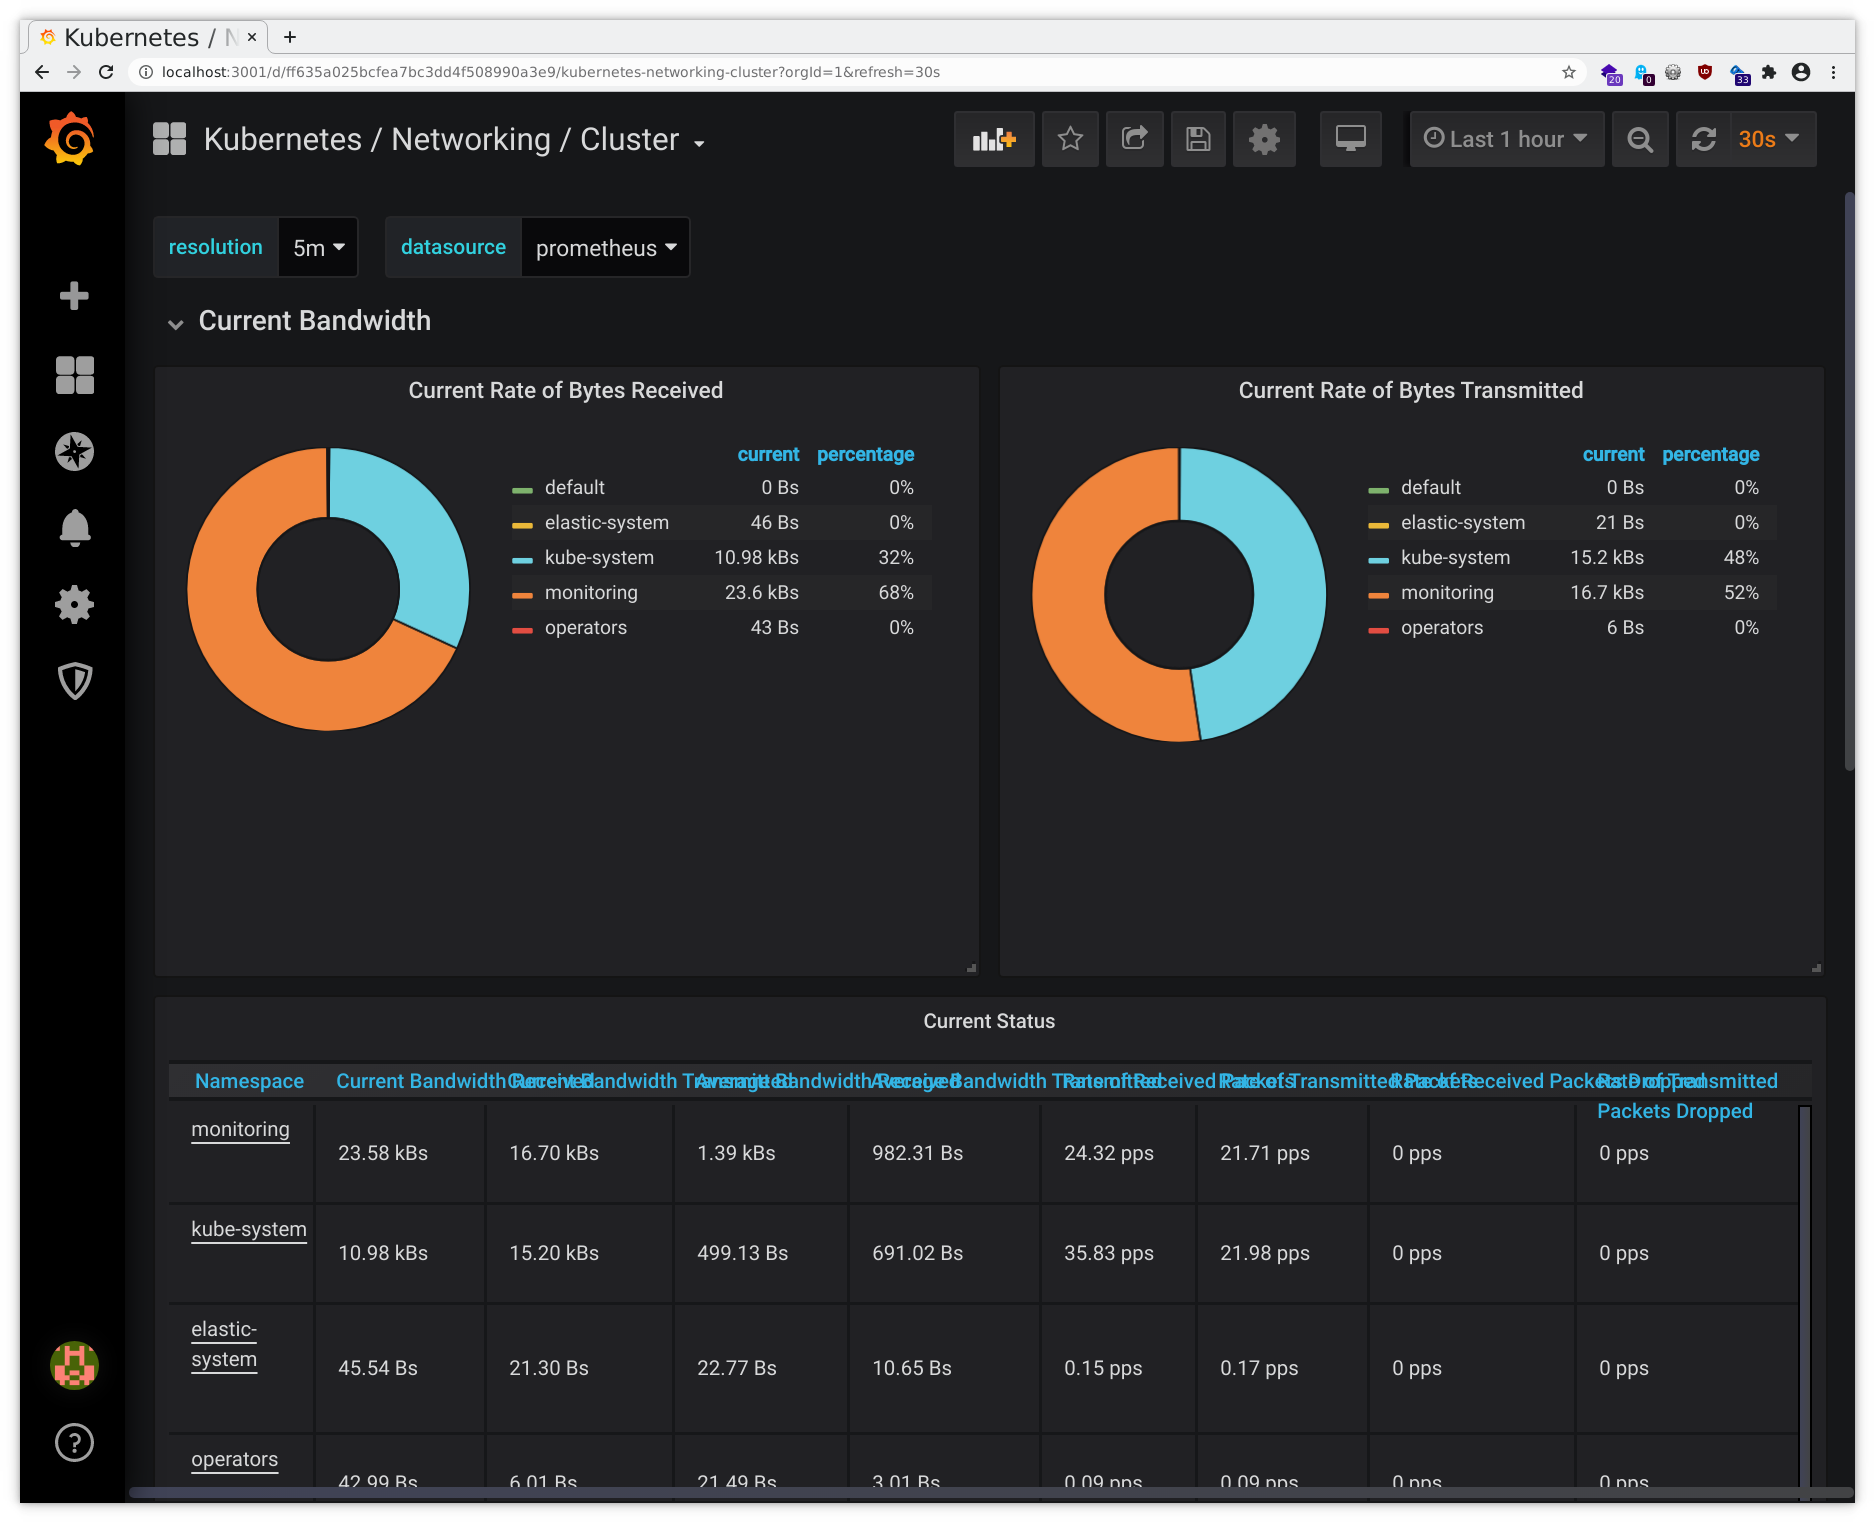
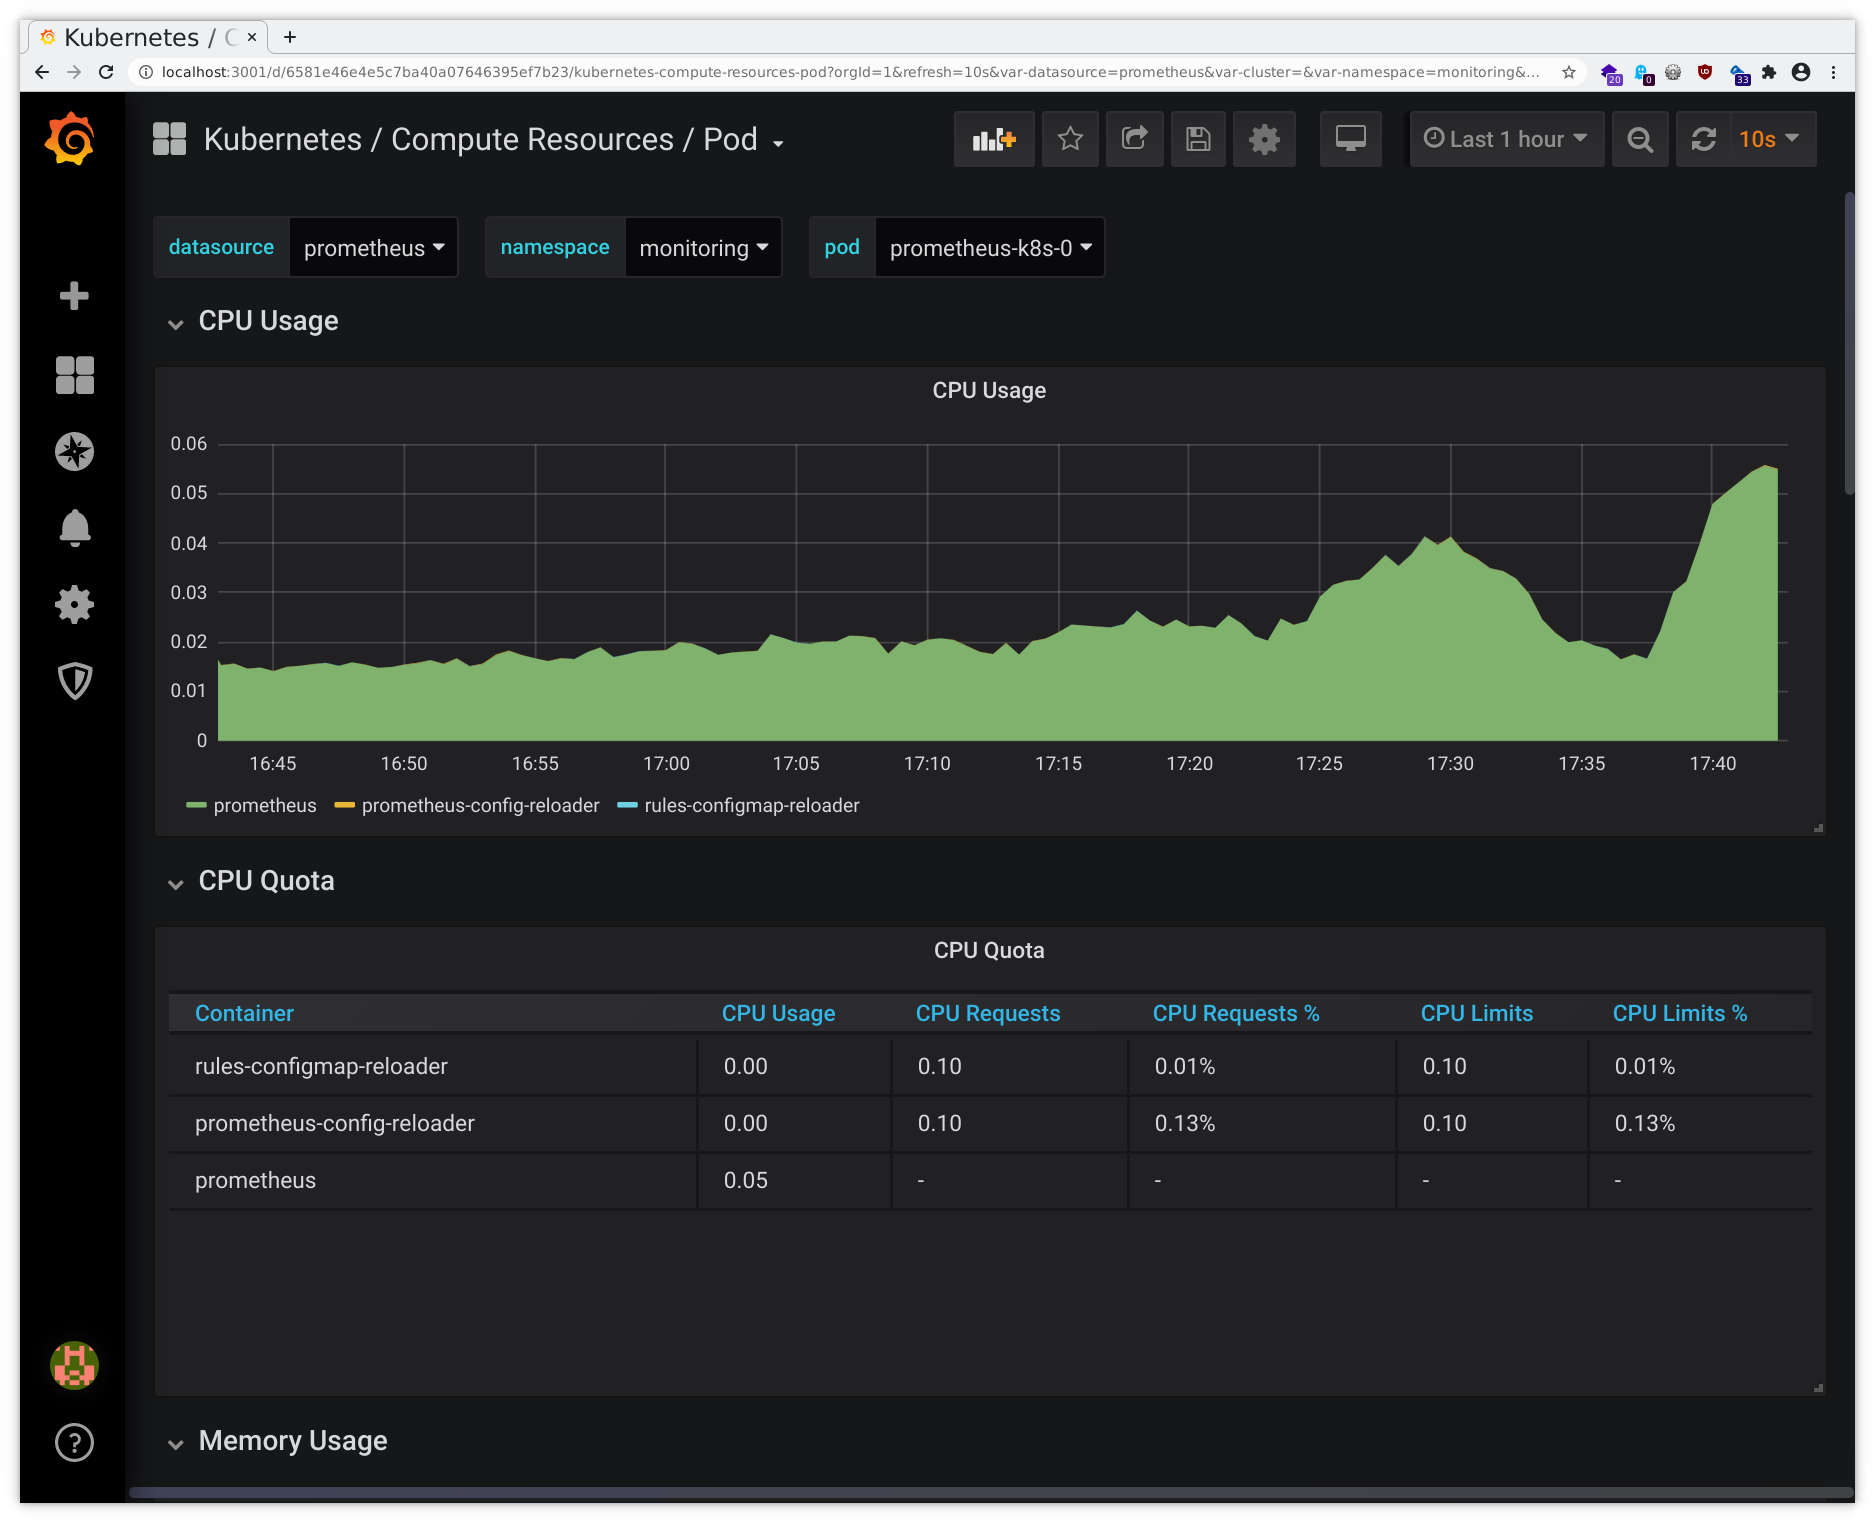
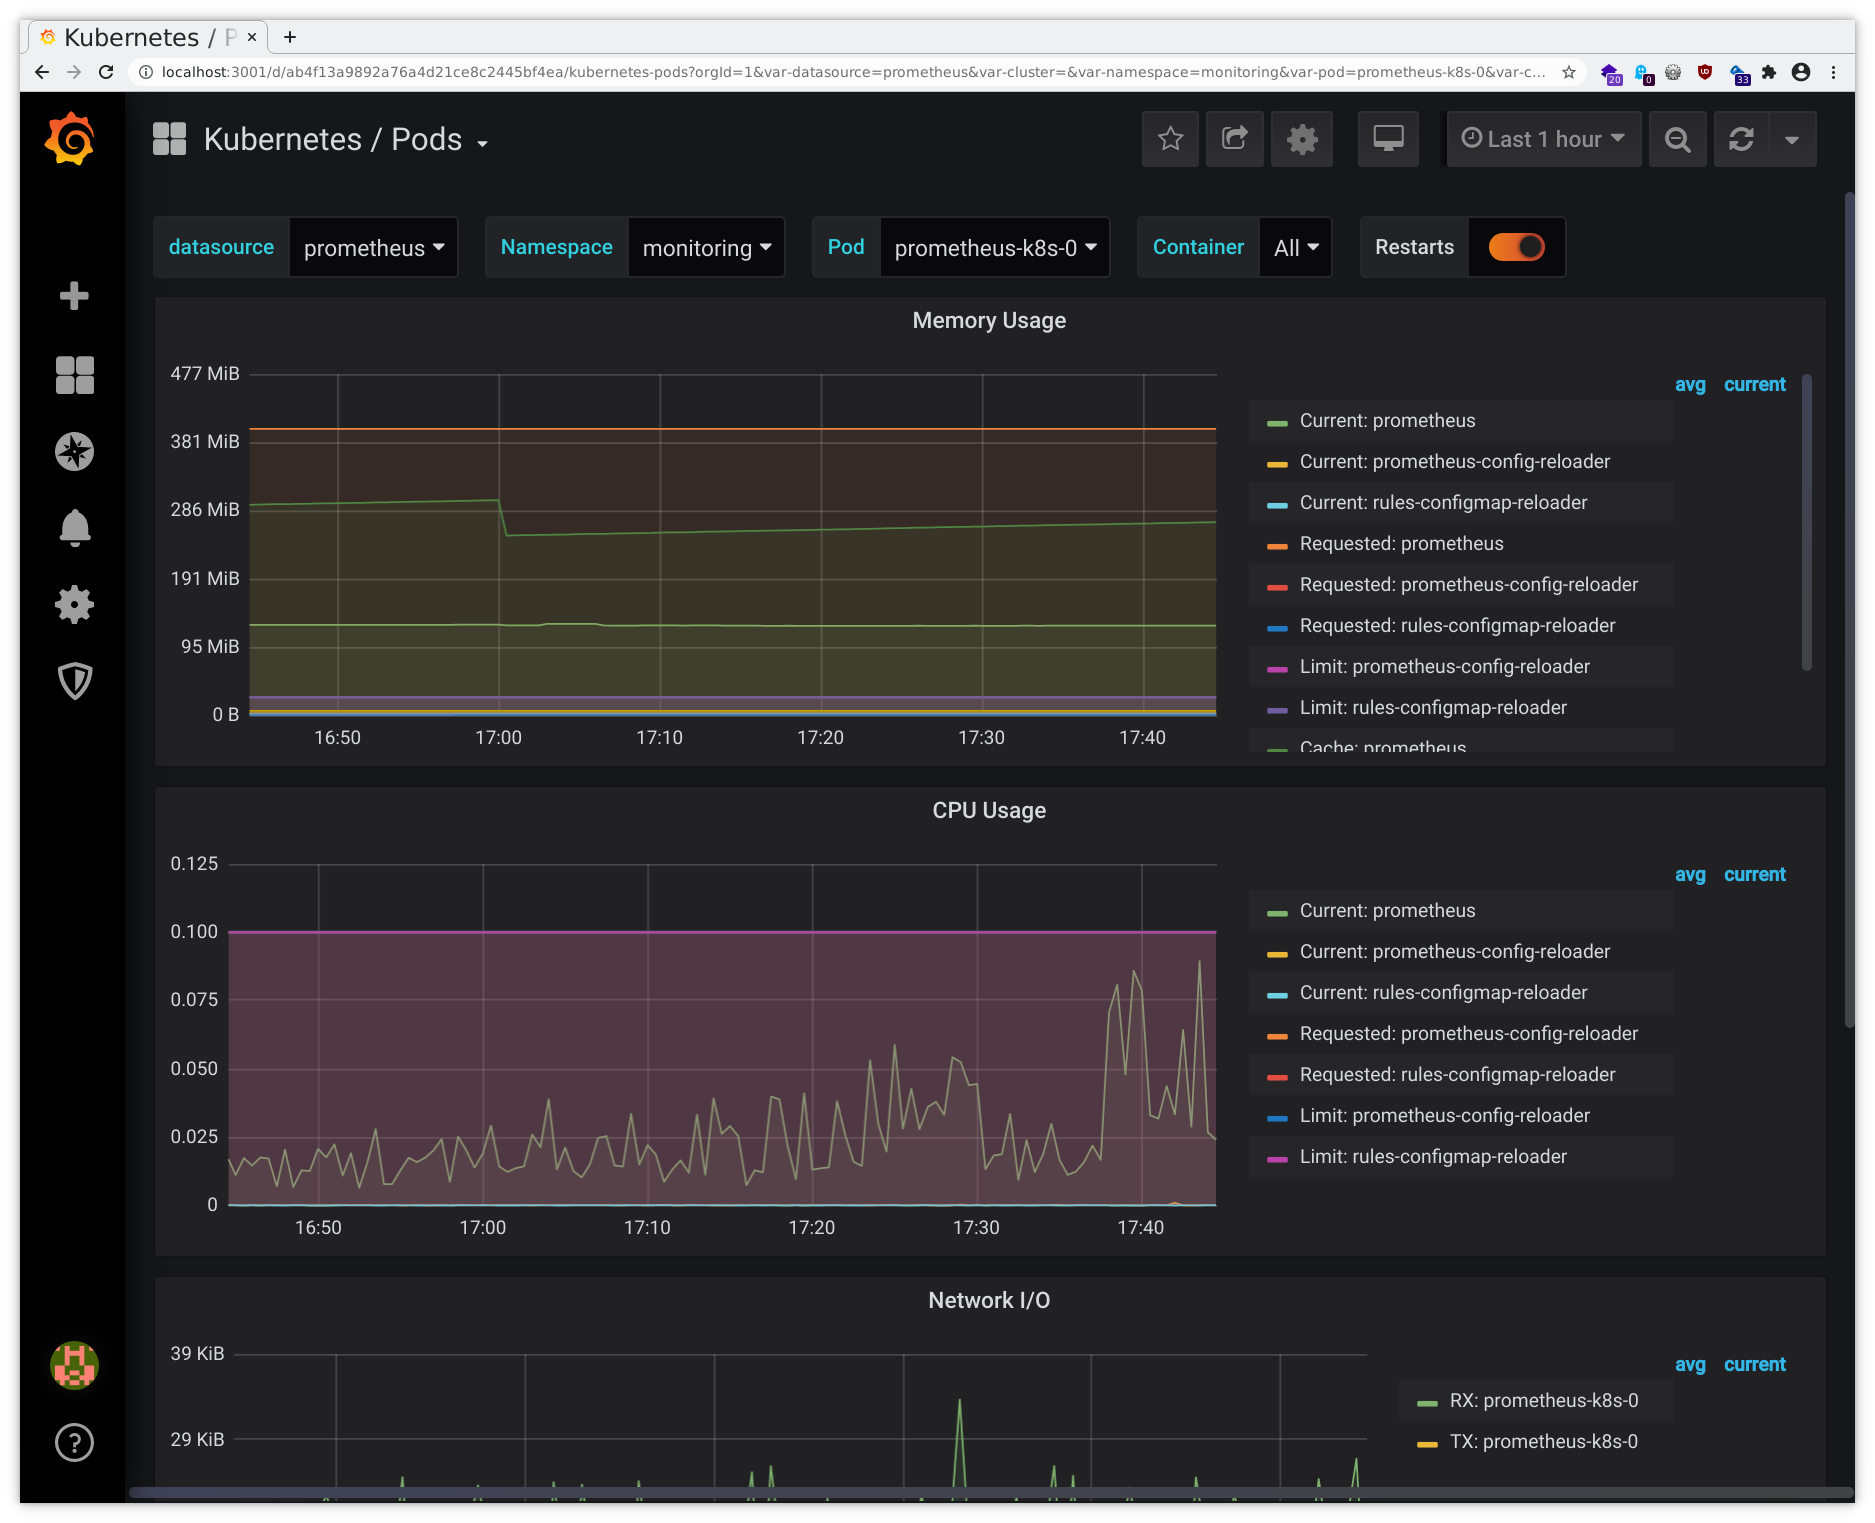
Beware the screenshots may differ from the actual web interface and are to be considered as examples only.
Exercise - Gather and inspect Postgres metrics
Tip
Here we now start to delve deeper in the Prometheus-specific way of retrieving additional application metrics, using a so-called Prometheus exporter for postgres and a custom Java agent for todoui/todobackend. For a more generic way of doing this you might want to skip this subchapter and continue with OpenTelemetry instead.
So far we had only checked node-level metrics and container metrics, so let’s dive a bit deeper now. First extend our postgresdb Deployment to gain yet another specialized sidecar container, this time one configured to export some metrics on its predefined default port using the Prometheus standard interface (yes, execute it all at once):
cat <<.EOF >> postgres-storage.yaml
        - image: prometheuscommunity/postgres-exporter:v0.17.1
          name: postgres-exporter
          env:
            - name: DATA_SOURCE_URI
              value: 'localhost/postgres?sslmode=disable'
            - name: DATA_SOURCE_USER
              valueFrom:
                secretKeyRef:
                  name: db-security
                  key: db.user.name
            - name: DATA_SOURCE_PASS
              valueFrom:
                secretKeyRef:
                  name: db-security
                  key: db.user.password
.EOF
Apply this configuration, causing the Deployment to be recreated (which, incidentally, will wipe out any Istio adjustments, if still present):
kubectl apply -f postgres-storage.yaml
Once the postgresdb Pod will be running again (this time with READY 3/3) open a separate terminal and within that establish a port-forwarding to postgresdb:
kubectl port-forward $(kubectl get pods -l tier=database -o name) 9187:9187
Check whether the newly added postgres-exporter container really provides any data on its default port:
curl --silent http://localhost:9187/metrics | grep 'pg_up'
which should yield something along the lines of
# HELP pg_up Whether the last scrape of metrics from PostgreSQL was able to connect to the server (1 for yes, 0 for no).
# TYPE pg_up gauge
pg_up 1
Adjust (or omit) the grep to view more data. Now how to tell our Prometheus to scrape that newly available metrics source?
First, let’s open up another port on our postgres ClusterIP Service, and also consolidate the adjustments done on-the-fly in the Istio chapter :
- add the port 9187 named http-metrics
- name the postgres port 5432 appropriately
- and insert the Service label
Edit your local postgres-service.yaml accordingly.
When you are confident your adjustments are complete (feel free to check the solution given above), apply it:
kubectl apply -f postgres-service.yaml
This should not lead to any Service disruptions. Now tell our Prometheus operator where to find these metrics by using a
ServiceMonitor resource, telling where to look and how often. Prometheus searches for ServiceMonitors with the label
release: monitoring. Execute all at once:
cat <<.EOF > postgres-metrics.yaml
apiVersion: monitoring.coreos.com/v1
kind: ServiceMonitor
metadata:
  name: postgresdb
  labels:
    # Label to tell prometheus to select this ServiceMonitor to scrape metrics
    release: monitoring
spec:
  endpoints:
    - interval: 15s
      port: http-metrics
  selector:
    matchLabels:
      app: postgresdb
.EOF
Apply this file via kubectl apply -f postgres-metrics.yaml, and after a short while you should be able to see the
predefined Grafana dashboard filling with data:
- connect to Grafana as given above
- from the dashboard list in the upper left corner choose PostgreSQL Database
- make sure to select <your_PostgresDB_Pod_IP:9187> from the dropdown list for Instance
- (yes, this community-provided dashboard is due for a general overhaul …)
Exercise - Gather and inspect application metrics
Many applications readily make available internal statistics that could then taken up and transformed to be exported for metrics scraping, e.g. Apache’s server-status and the corresponding Apache exporter, or Postgres as given above. Cf. Prometheus’ list of third-party exporters .
Some applications directly expose metrics in the Prometheus format, so no separate exporters are needed, e.g. Kubernetes itself, Linkerd, Traefik, … Cf. Prometheus’ list of software exposing Prometheus metrics .
And for some applications no such direct integration is available, and instead instrumentation must be added to code. Cf. Prometheus’ list of client libraries .
But there also is some middle ground: for instance, some insight into Java applications can be gained by running them accompanied by a suitable Java Agent. Let’s try this now using Novatec’s inspectIT Ocelot .
todobackend
So, start out by adjusting our local todobackend.yaml file by
- now referencing our pre-generated image “novatec/technologyconsulting-containerexerciseapp-todobackend:v0.2-ocelot”
containing Ocelot integration
- consisting of just adding the Java Agent JAR file and adjusting the default command executed when creating an instance from that image
- and also providing some basic Ocelot configuration via an environment variable
Tip
For reference, you can pull the old and the new Docker image to your workstation and compare the contents:
docker pull novatec/technologyconsulting-containerexerciseapp-todobackend:v0.2
docker pull novatec/technologyconsulting-containerexerciseapp-todobackend:v0.2-ocelot
docker inspect novatec/technologyconsulting-containerexerciseapp-todobackend:v0.2 > old
docker inspect novatec/technologyconsulting-containerexerciseapp-todobackend:v0.2-ocelot > new
jsondiff old new | jq '.' | grep -B1 -A3 '"add"'
which should yield something like
  {
    "op": "add",
    "path": "/0/Config/Cmd/1",
    "value": "-XX:+ExitOnOutOfMemoryError"
  },
  {
    "op": "add",
    "path": "/0/Config/Cmd/2",
    "value": "-javaagent:/opt/todobackend/inspectit-ocelot-agent-1.6.1.jar"
  },
--
  {
    "op": "add",
    "path": "/0/RootFS/Layers/8",
    "value": "sha256:b46ea95ec68e5bab5ff04a944e0050ef40611469f31265d1200c167a63f7102e"
  },
So, some command parameters have been added, and there is a new image layer which - as I can simply reveal here - just contains the Java Agent JAR file. You can see more details e.g. by clicking on a tag on [Docker Hub][docker-hub], or, locally, when installing [container-diff][container-diff].
Now apply this configuration, causing the Deployment to be recreated (which, incidentally, will wipe out any Istio adjustments, if still present):
kubectl apply -f todobackend.yaml
Check via kubectl get po, and once the todobackend Pod will be running again check whether the Java Agent has been
called:
kubectl exec deployment/todobackend -- ps auxwwkstart_time
which should contain something along the lines of
PID   USER     TIME  COMMAND
    1 root      0:58 java -XX:+ExitOnOutOfMemoryError -javaagent:/opt/todobackend/inspectit-ocelot-agent-1.6.1.jar -jar todobackend-0.0.2-SNAPSHOT.jar
And also check whether it provides any data on its default port:
kubectl exec deployment/todobackend -- wget -qO- localhost:8888/metrics | grep 'inspectit_self_instrumentation_queue_size'
which should yield something along the lines of
# HELP inspectit_self_instrumentation_queue_size last value of the number of pending classes inspectIT has to check if they require instrumentation updates [classes]
# TYPE inspectit_self_instrumentation_queue_size gauge
inspectit_self_instrumentation_queue_size{host="todobackend-7d6f7bbf9c-ksnkv",host_address="10.244.0.36",service="todobackend",} 0.0
And just like above for Postgres, we now have to open up another port on our corresponding Service, and we also can take the chance to consolidate the adjustments done on-the-fly in the Istio chapter:
- add the port 8888 named http-metrics
- name the todobackend port 8080 appropriately
- and insert the Service label
Edit your local todobackend-service.yaml accordingly.
When you are confident your adjustments are complete (feel free to check the solution given above), apply it:
kubectl apply -f todobackend-service.yaml
This should not lead to any Service disruptions. Now tell our Prometheus operator where to find these metrics by using a ServiceMonitor resource, indicating where to look and how often (yes, execute it all at once):
cat <<.EOF > todobackend-metrics.yaml
apiVersion: monitoring.coreos.com/v1
kind: ServiceMonitor
metadata:
  name: todobackend
  labels:
    # Label to tell prometheus to select this ServiceMonitor to scrape metrics
    release: monitoring
spec:
  endpoints:
    - interval: 15s
      port: http-metrics
  selector:
    matchLabels:
      app: todobackend
.EOF
Apply this file via kubectl apply -f todobackend-metrics.yaml. The selector of this ServiceMonitor will ensure to
select the correct Service to monitor, and the name of this Service (i.e. “todobackend”) will then be used for storing
the metrics.
todoui
And then just collect some similar settings from the preceding chapters/exercises for our todoui resources, starting
with our local todoui-versioned-0-3.yaml:
Info
You don’t have any such todoui-versioned-0-3.yaml?
Then you seem to have omitted the Istio
subchapter, which is totally fine.
In this case, please just delete your current todoui Deployment/HPA via kubectl delete deployment,hpa todoui and proceed as per below, peeking at the solution if desired.
- limits for resources as used during
Horizontal Pod Autoscaling
(in
preparation for a later exercise)
- and while we are at it, let’s also directly configure a HorizontalPodAutoscaler (HPA) in a certain way (in preparation for a later exercise)
- podAntiAffinity as used during Stateful Sets (in preparation for a later exercise)
- an updated Docker image “novatec/technologyconsulting-containerexerciseapp-todoui:v0.3-ocelot” containing Ocelot
integration
- consisting of just adding the Java Agent JAR file and adjusting the default command executed when creating an instance from that image
- and also providing some basic Ocelot configuration via an environment variable
As the above data are collected from various places feel free to check the solution below if you don’t want to bother hunting down all details. You can check the highlighted parts from above in detail.
Apply this configuration, causing the Deployment to be recreated (which, incidentally, will wipe out any Istio adjustments, if still present):
kubectl apply -f todoui-versioned-0-3.yaml
Check via kubectl get po, and once the todoui-0-3 Pod will be running again check whether the Java Agent has been
called:
kubectl exec deployment/todoui-0-3 -- ps auxwwkstart_time
which should contain something along the lines of
PID   USER     TIME  COMMAND
    1 root      0:58 java -XX:+ExitOnOutOfMemoryError -javaagent:/opt/todoui/inspectit-ocelot-agent-1.6.1.jar -jar todoui-0.0.3-SNAPSHOT.jar
And also check whether it provides any data on its default port:
kubectl exec deployment/todoui-0-3 -- wget -qO- localhost:8888/metrics | grep 'inspectit_self_instrumentation_queue_size'
which should yield something along the lines of
# HELP inspectit_self_instrumentation_queue_size last value of the number of pending classes inspectIT has to check if they require instrumentation updates [classes]
# TYPE inspectit_self_instrumentation_queue_size gauge
inspectit_self_instrumentation_queue_size{host="todoui-0-3-86676ff4c4-7p6wb",host_address="10.244.0.37",service="todoui",} 0.0
And just like above for Postgres or our todobackend, we now have to open up another port on our corresponding Service, and we also can take the chance to consolidate the adjustments done on-the-fly in the Istio chapter:
- add the port 8888 named http-metrics
- name the todoui port 8080 appropriately
- and insert the Service label
Edit your local todoui-service.yaml accordingly.
When you are confident your adjustments are complete (feel free to check the solution given above), apply it:
kubectl apply -f todoui-service.yaml
This should not lead to any Service disruptions. Now tell our Prometheus operator where to find these metrics by using a ServiceMonitor resource, indicating where to look and how often (yes, execute it all at once):
cat <<.EOF > todoui-metrics.yaml
apiVersion: monitoring.coreos.com/v1
kind: ServiceMonitor
metadata:
  name: todoui
  labels:
    # Label to tell prometheus to select this ServiceMonitor to scrape metrics
    release: monitoring
spec:
  endpoints:
    - interval: 15s
      port: http-metrics
  selector:
    matchLabels:
      app: todoui
.EOF
Apply this file via kubectl apply -f todoui-metrics.yaml. The selector of this ServiceMonitor will ensure to select
the correct Service to monitor, and the name of this Service (i.e. “todoui”) will then be used for storing the metrics
(instead of the default service name “InspectIT Agent” as exported by Ocelot which Prometheus will store in a separate
label “exported_service”).
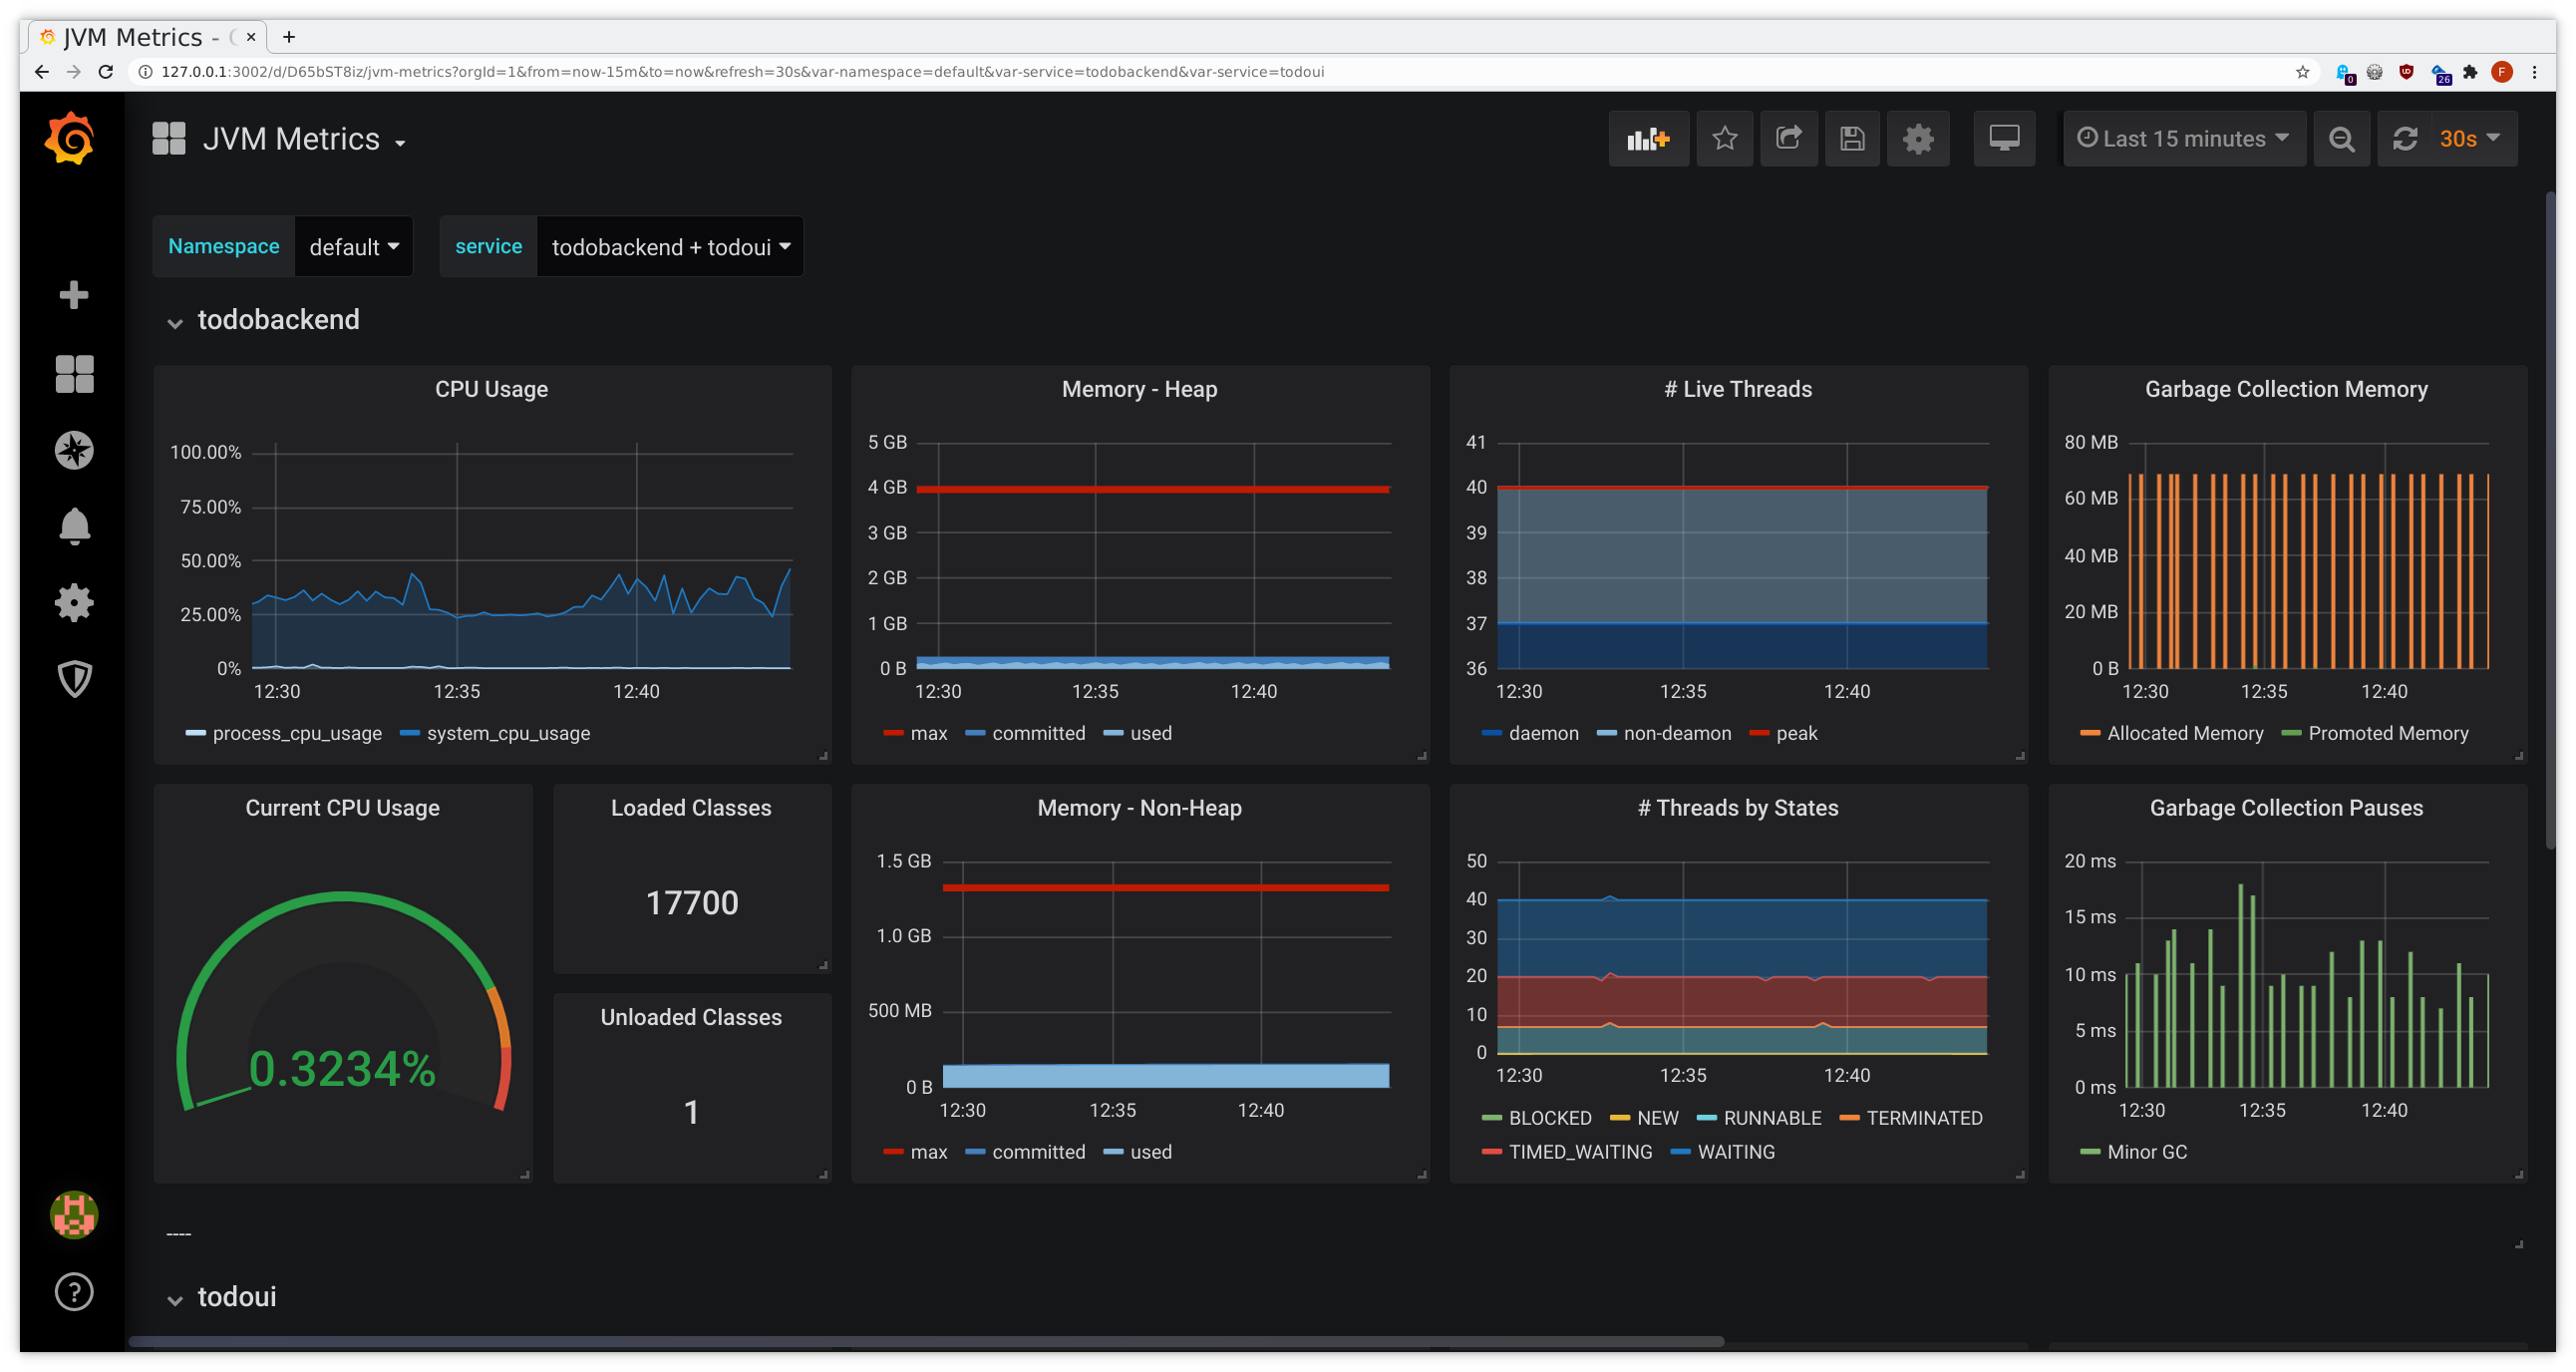
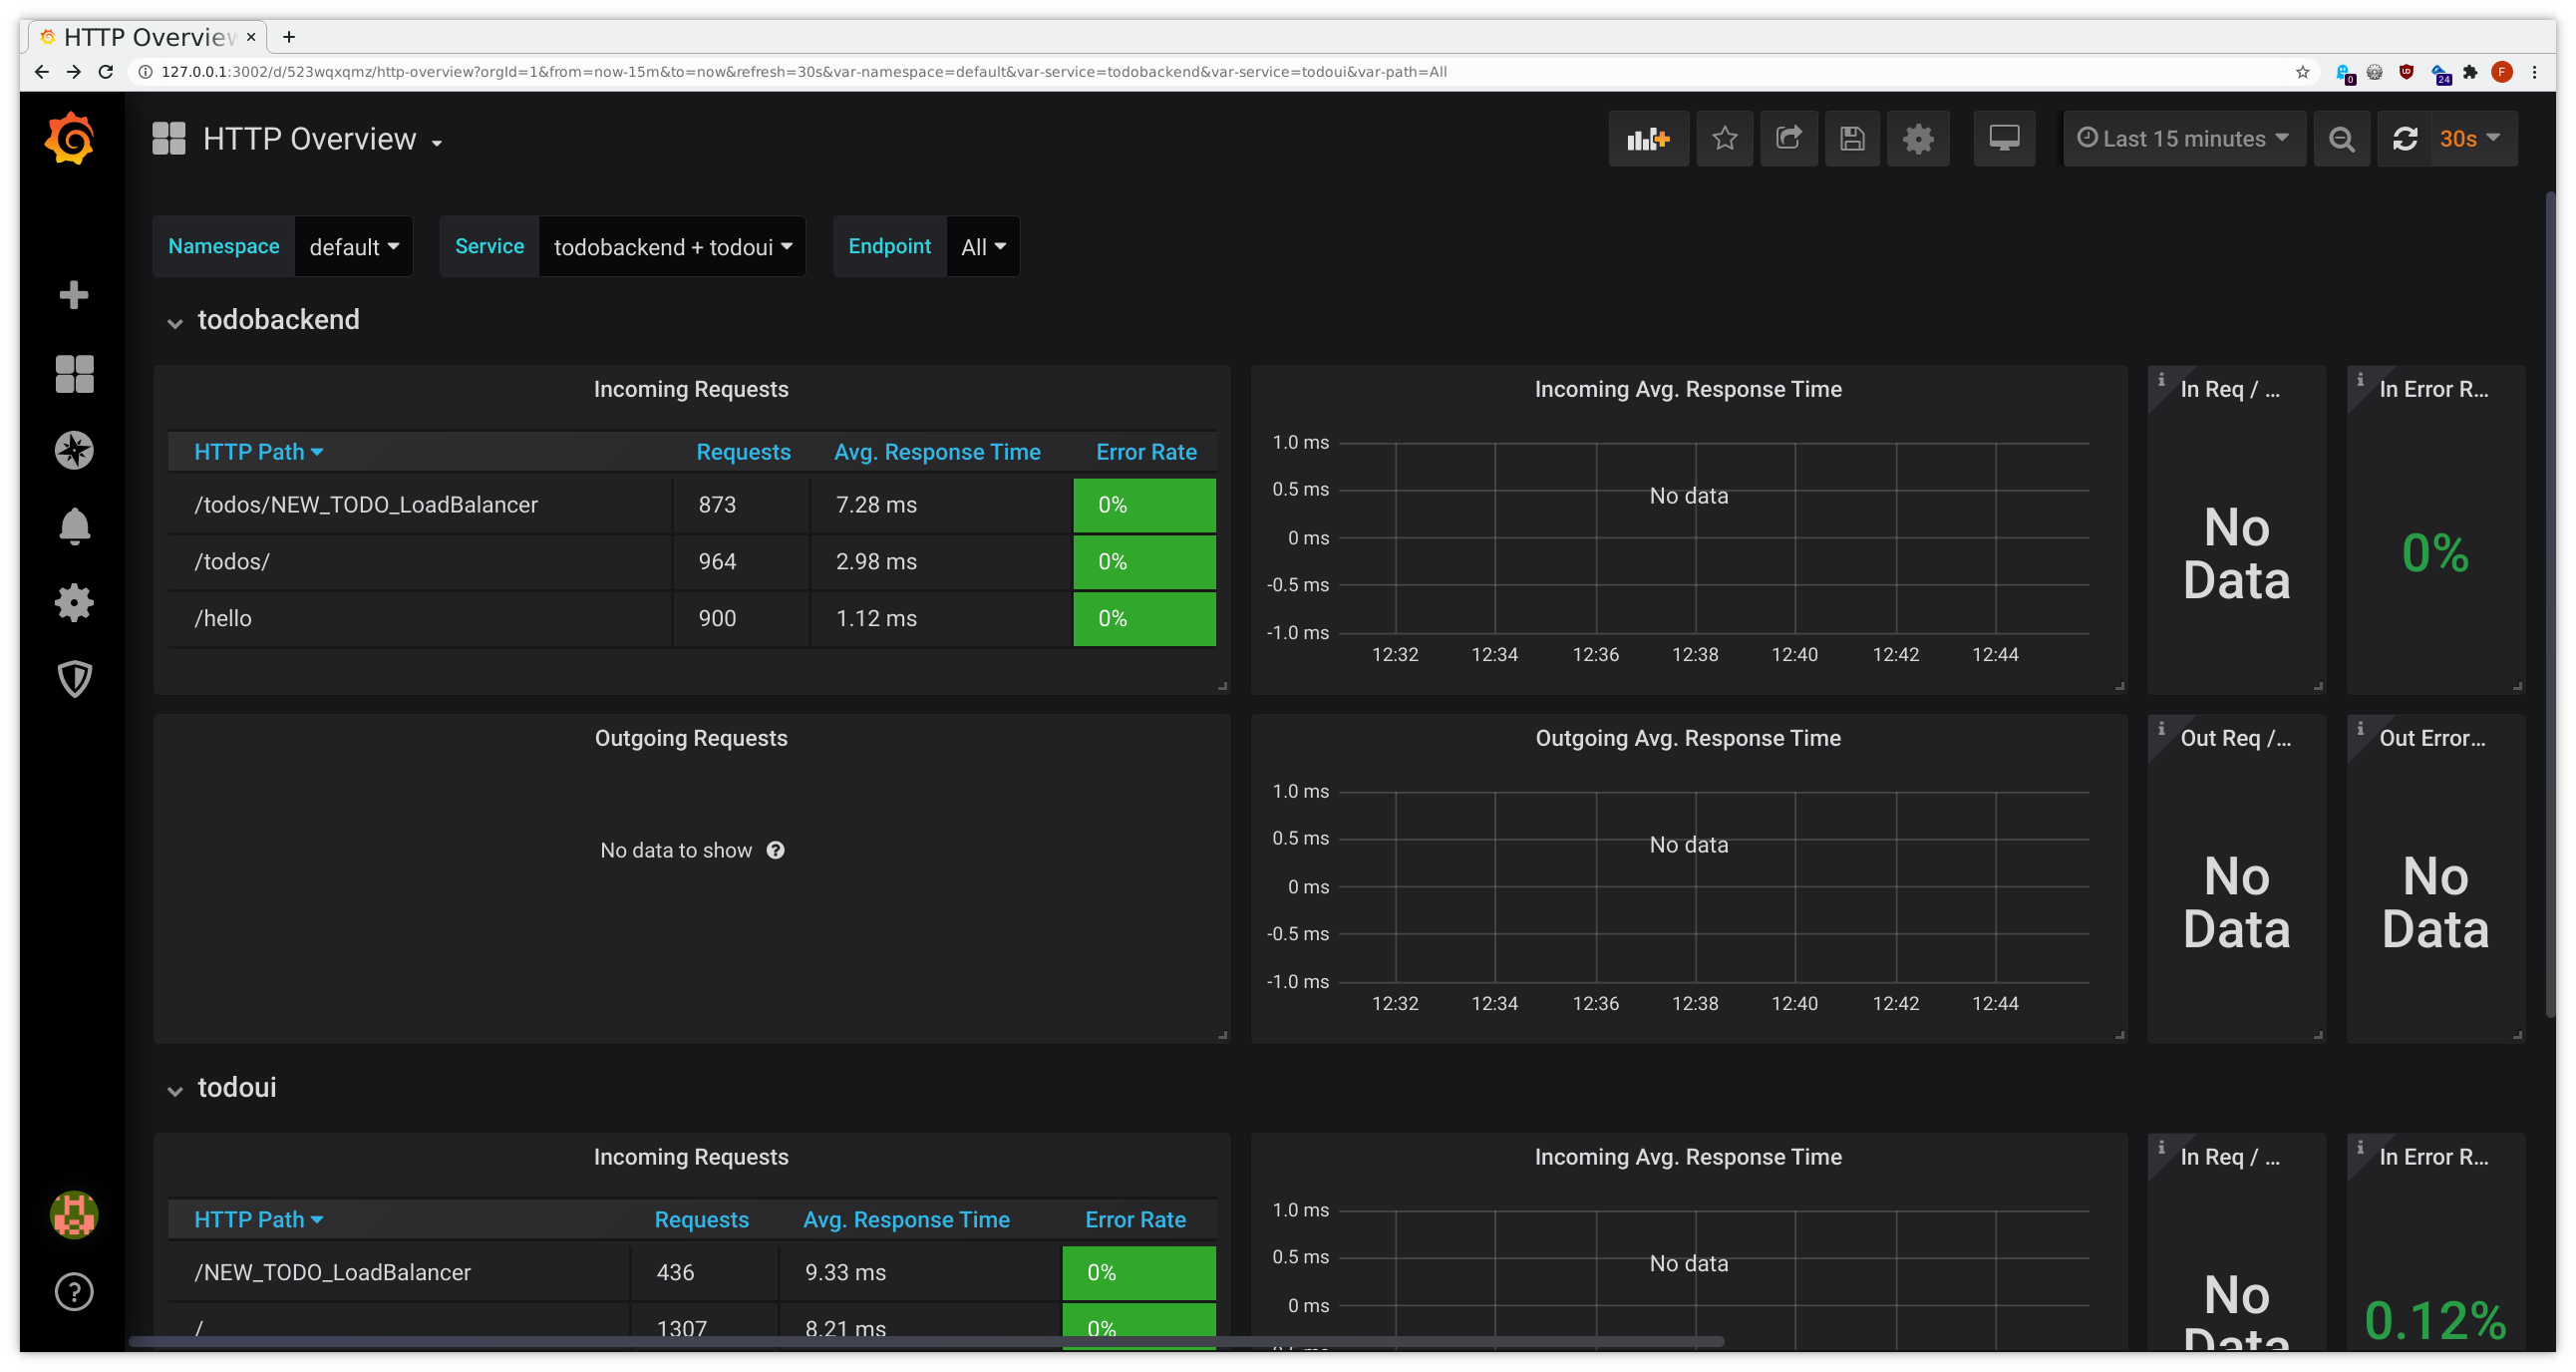
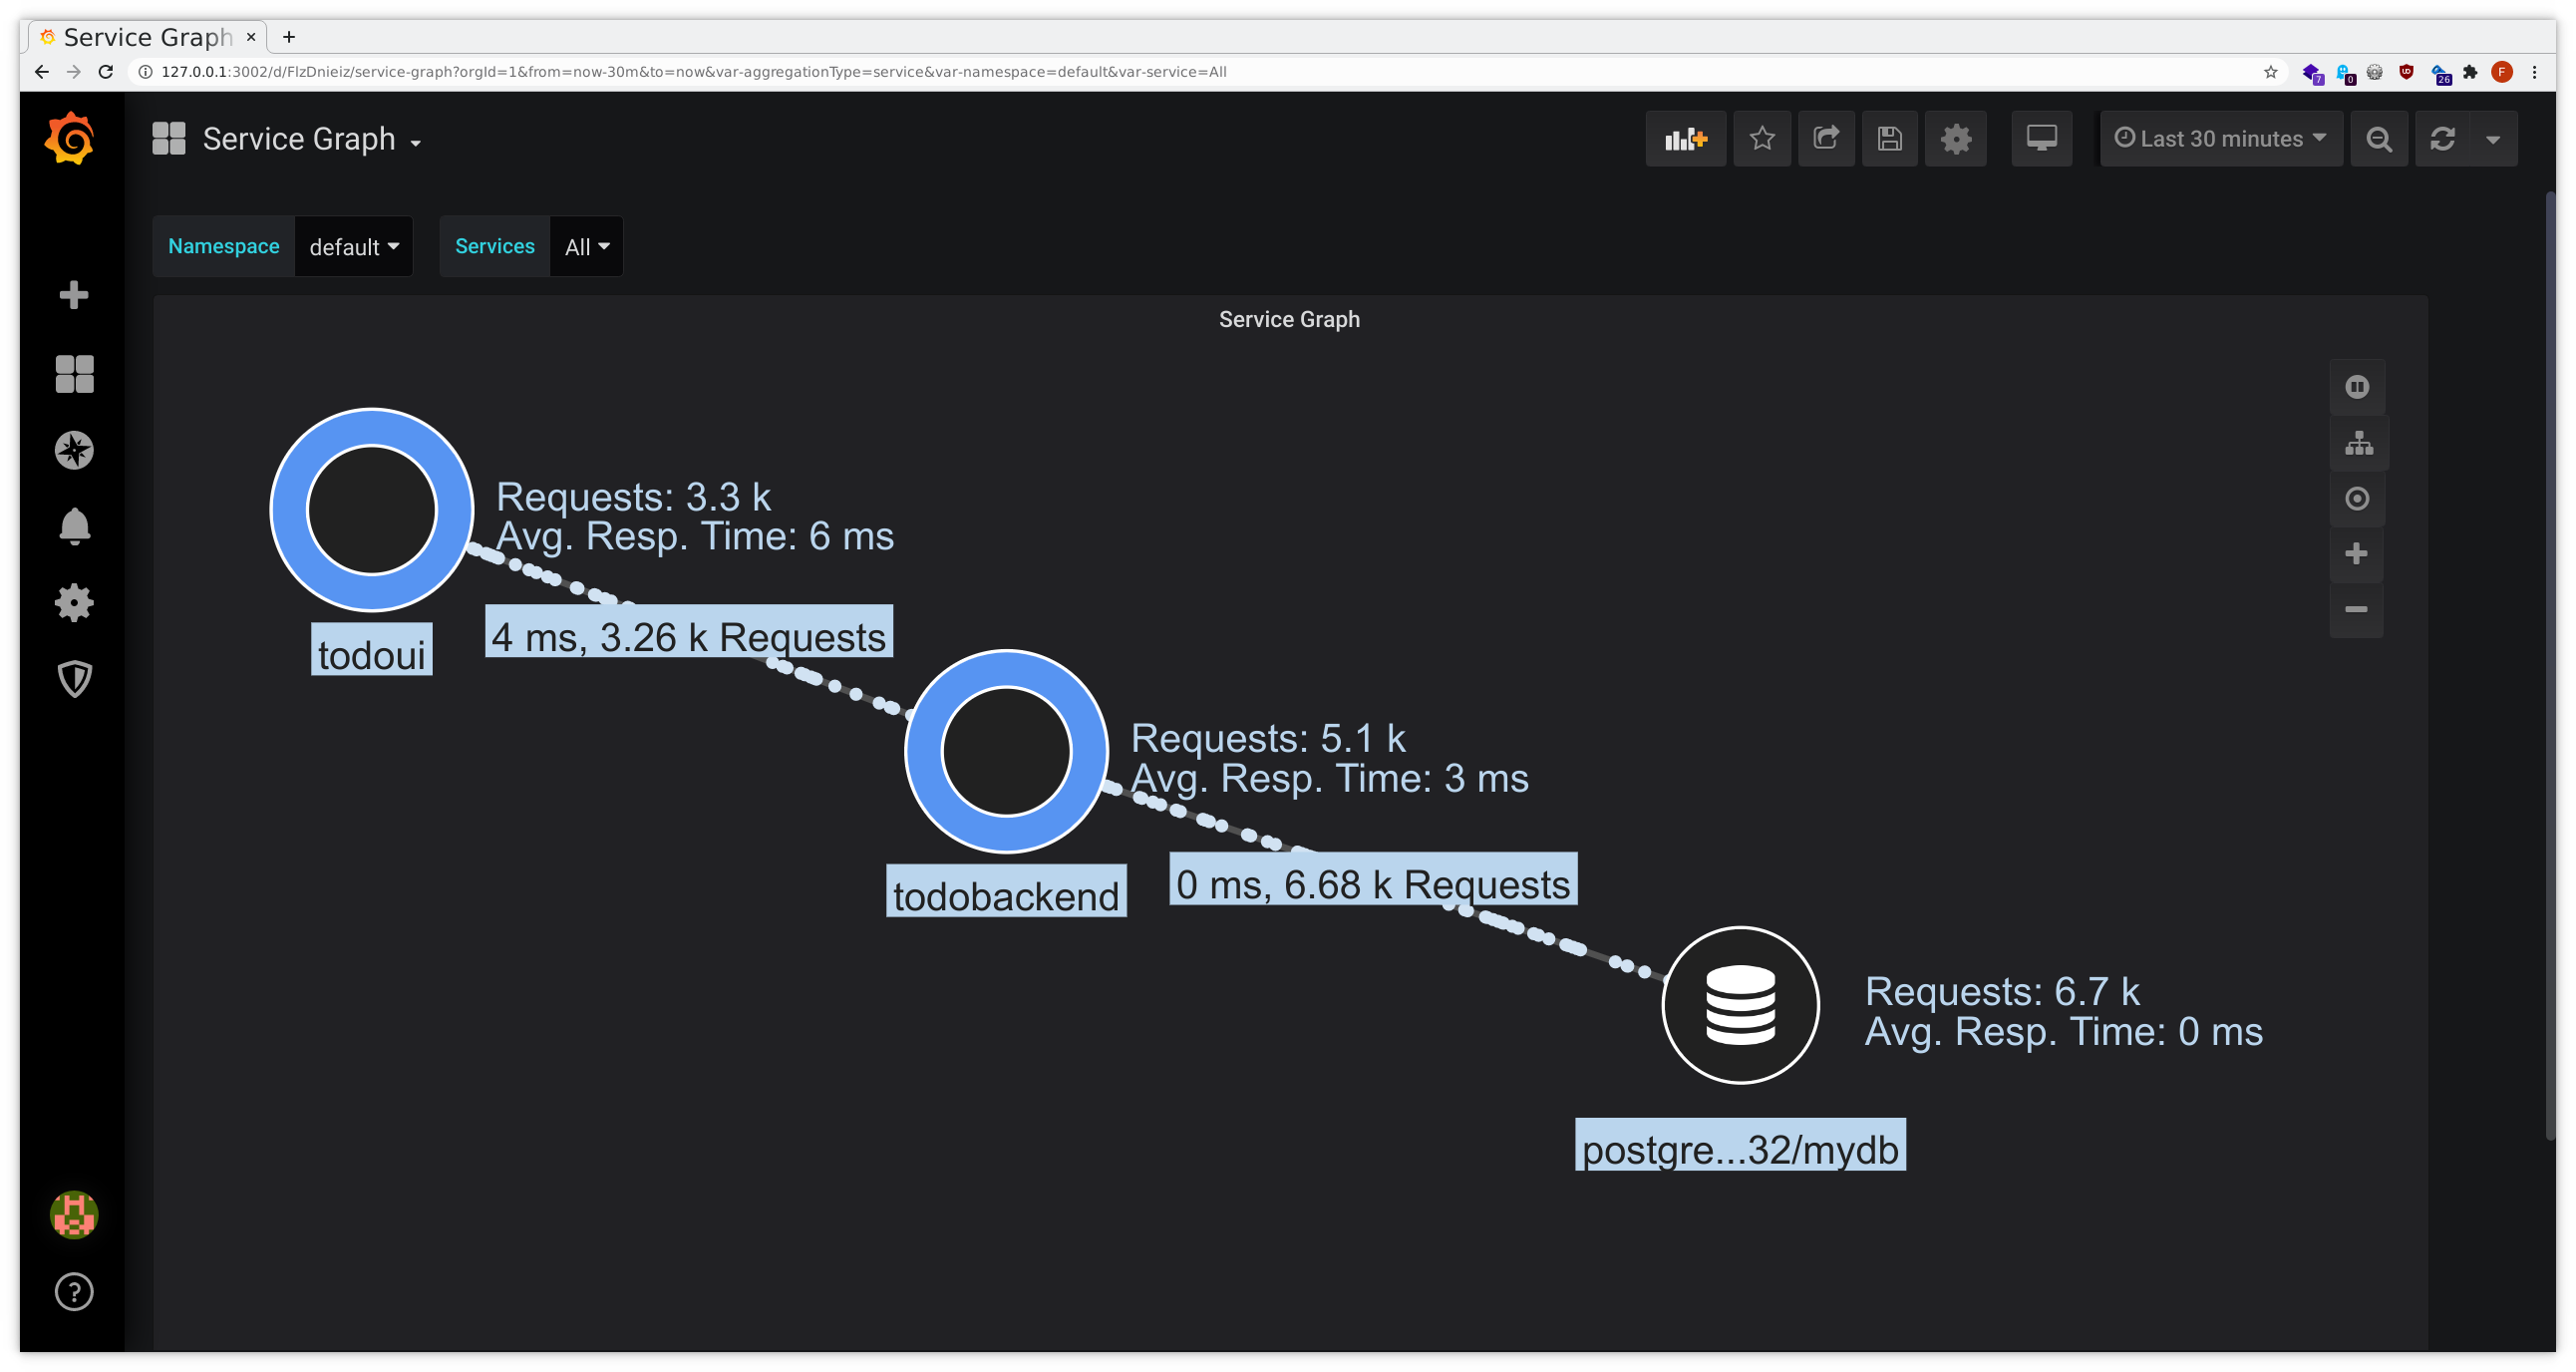
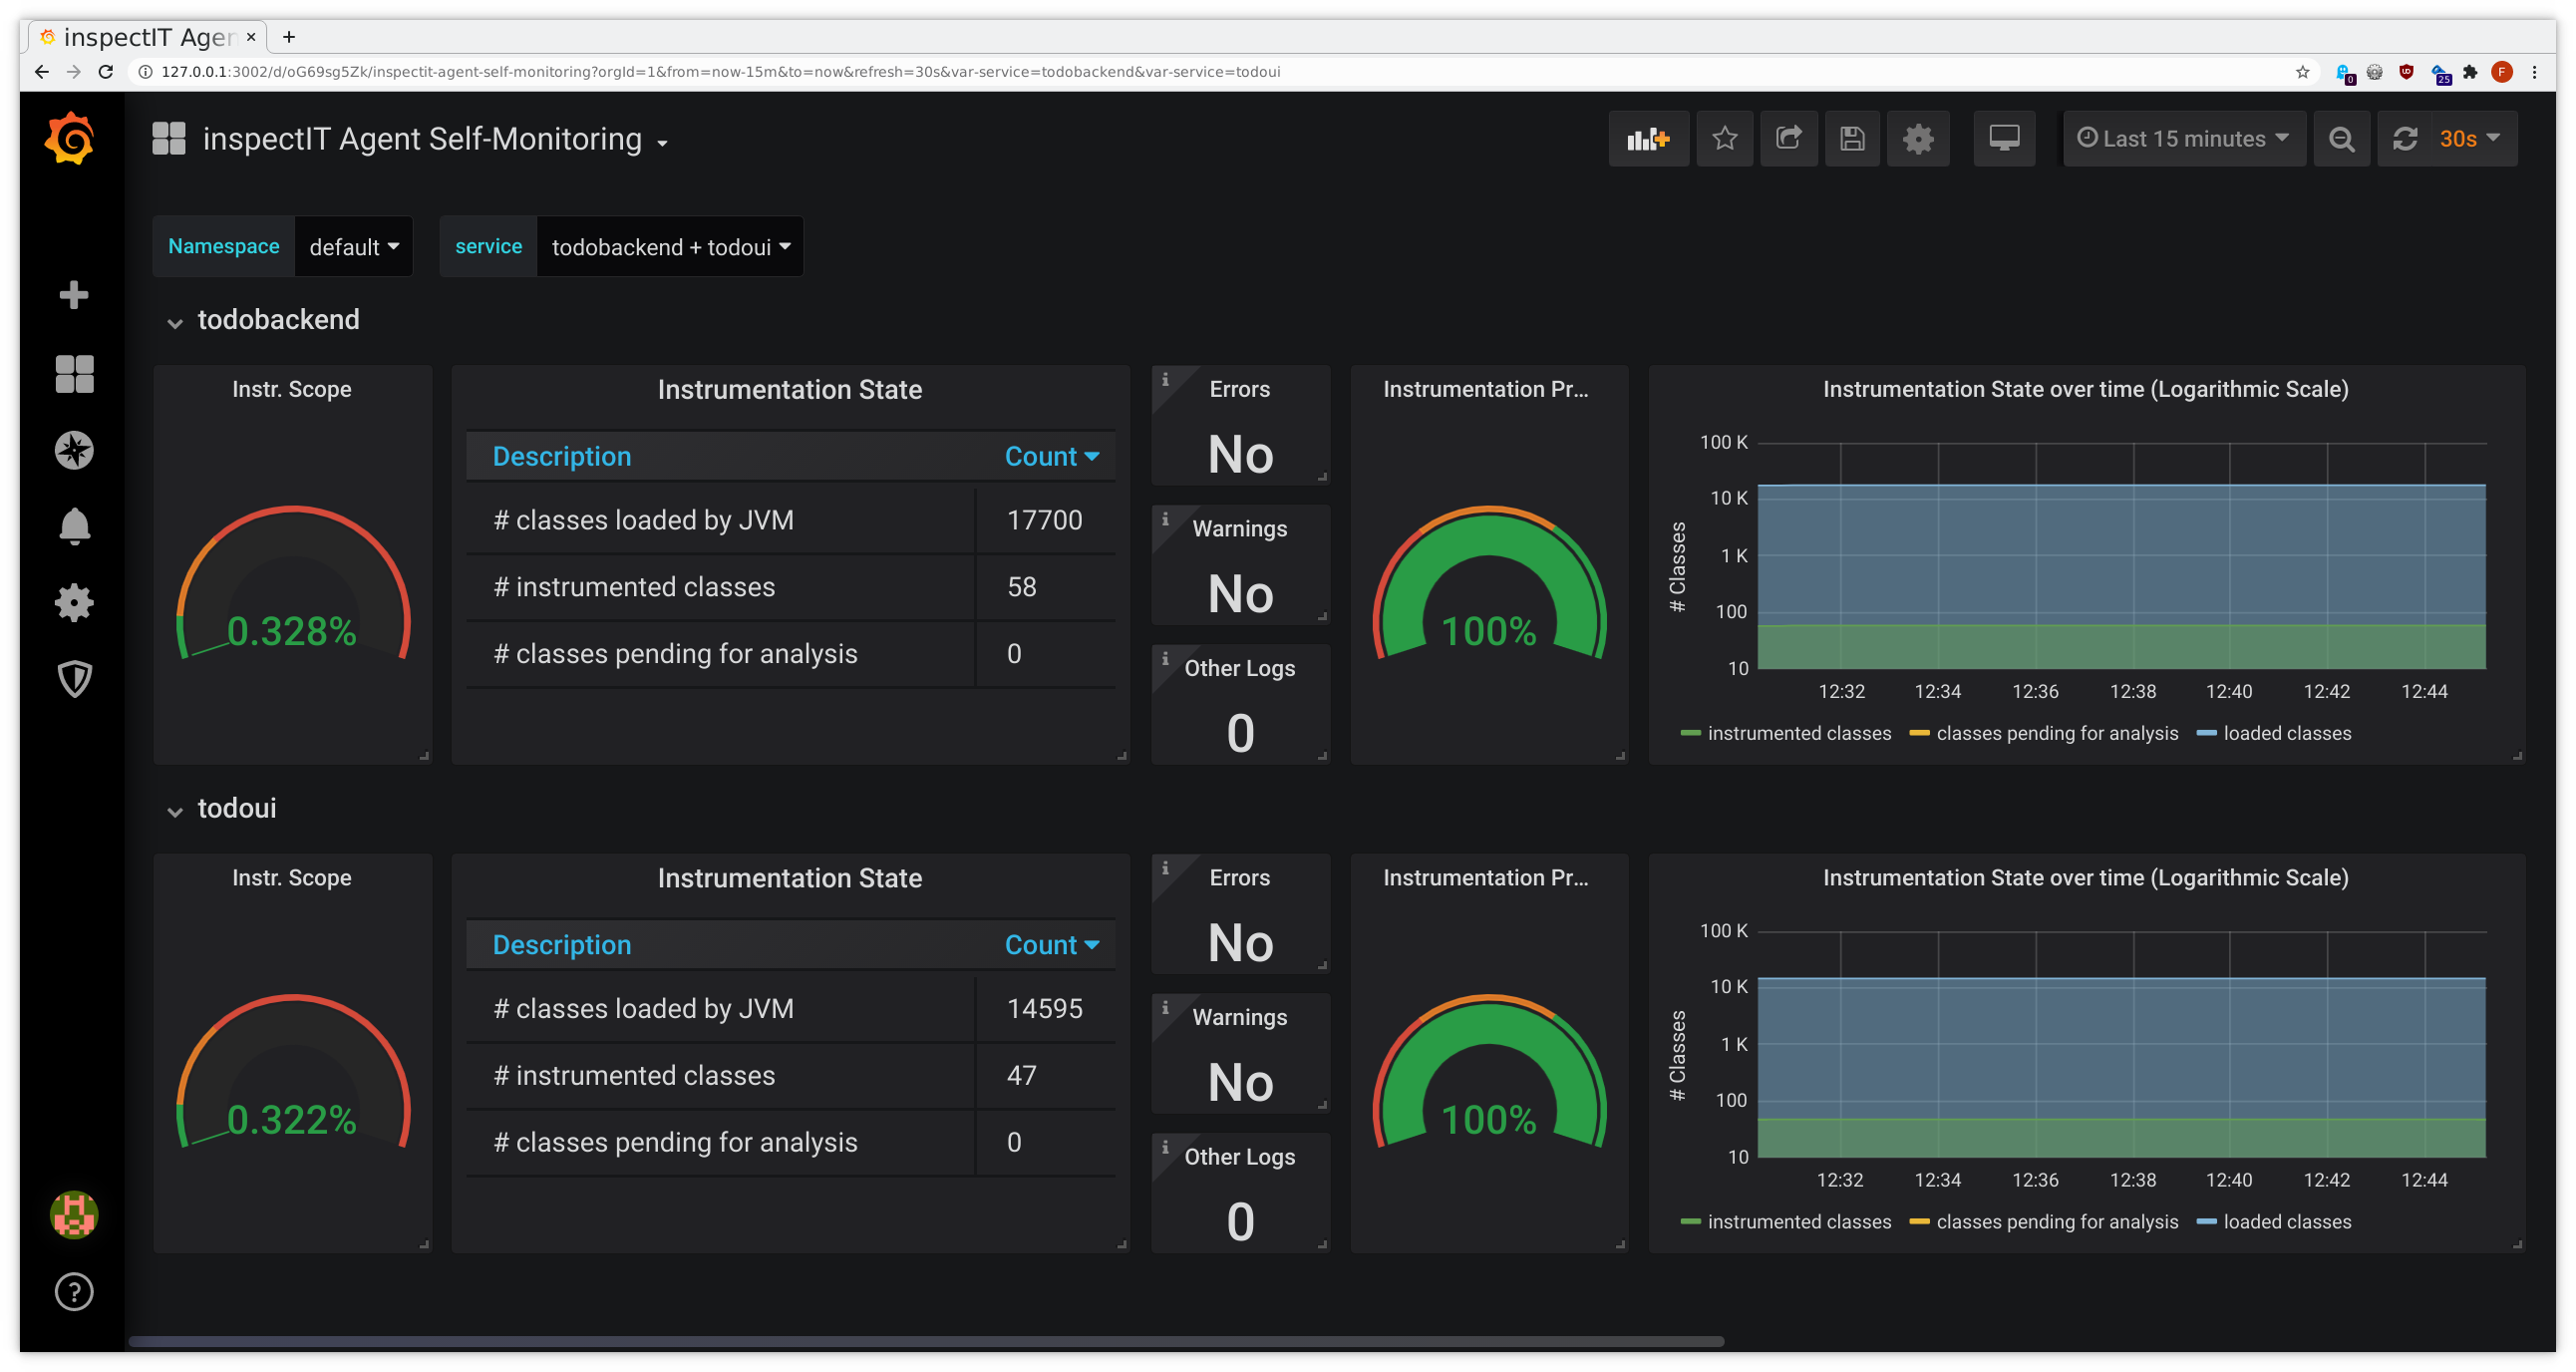
After a short while you should be able to see the predefined Grafana dashboards filling with data:
- connect to Grafana as given above
- from the dashboard list in the upper left corner choose JVM Metrics, HTTP Overview, Service Graph or
inspectIT Agent Self-Monitoring
- yes, HTTP Overview and Service Graph have a certain overlap with what we have seen during the Service Meshes exercises, due to similar scope
- make sure to select your namespace for Namespace and your namespace’s todoui/todobackend from the dropdown list for service or Service, respectively
This might look similarly to the following samples:
Exercise - Identify problems via monitoring
Let’s cause some trouble. Just a little bit for now, so no fully-blown chaos engineering, but rather “push” the appropriate “buttons” in our todoui.
First connect to Grafana as given
above
, and from the dashboard
list in the upper left corner open both JVM Metrics and Kubernetes / Compute Resources / Workload, configuring
each to display your namespace’s todoui. Of course we could just use kubectl top pod on the command line, but having
some graphs will help understanding the situation as it develops.
Then, in a separate terminal, call a special /leak endpoint of the todoui application, which forces it to add 10 million random numbers to a list that cannot ever be garbage-collected:
LOADBALANCER_IP=$(kubectl get svc todoui -o jsonpath="{.status.loadBalancer.ingress[0].ip}"); echo $LOADBALANCER_IP
CURL="curl --silent --location"
$CURL http://$LOADBALANCER_IP:8090/leak
While this will yield some rather normal-looking HTML output, perhaps after some short delay, in the graphs it will become apparent what has happened. It might look like this:
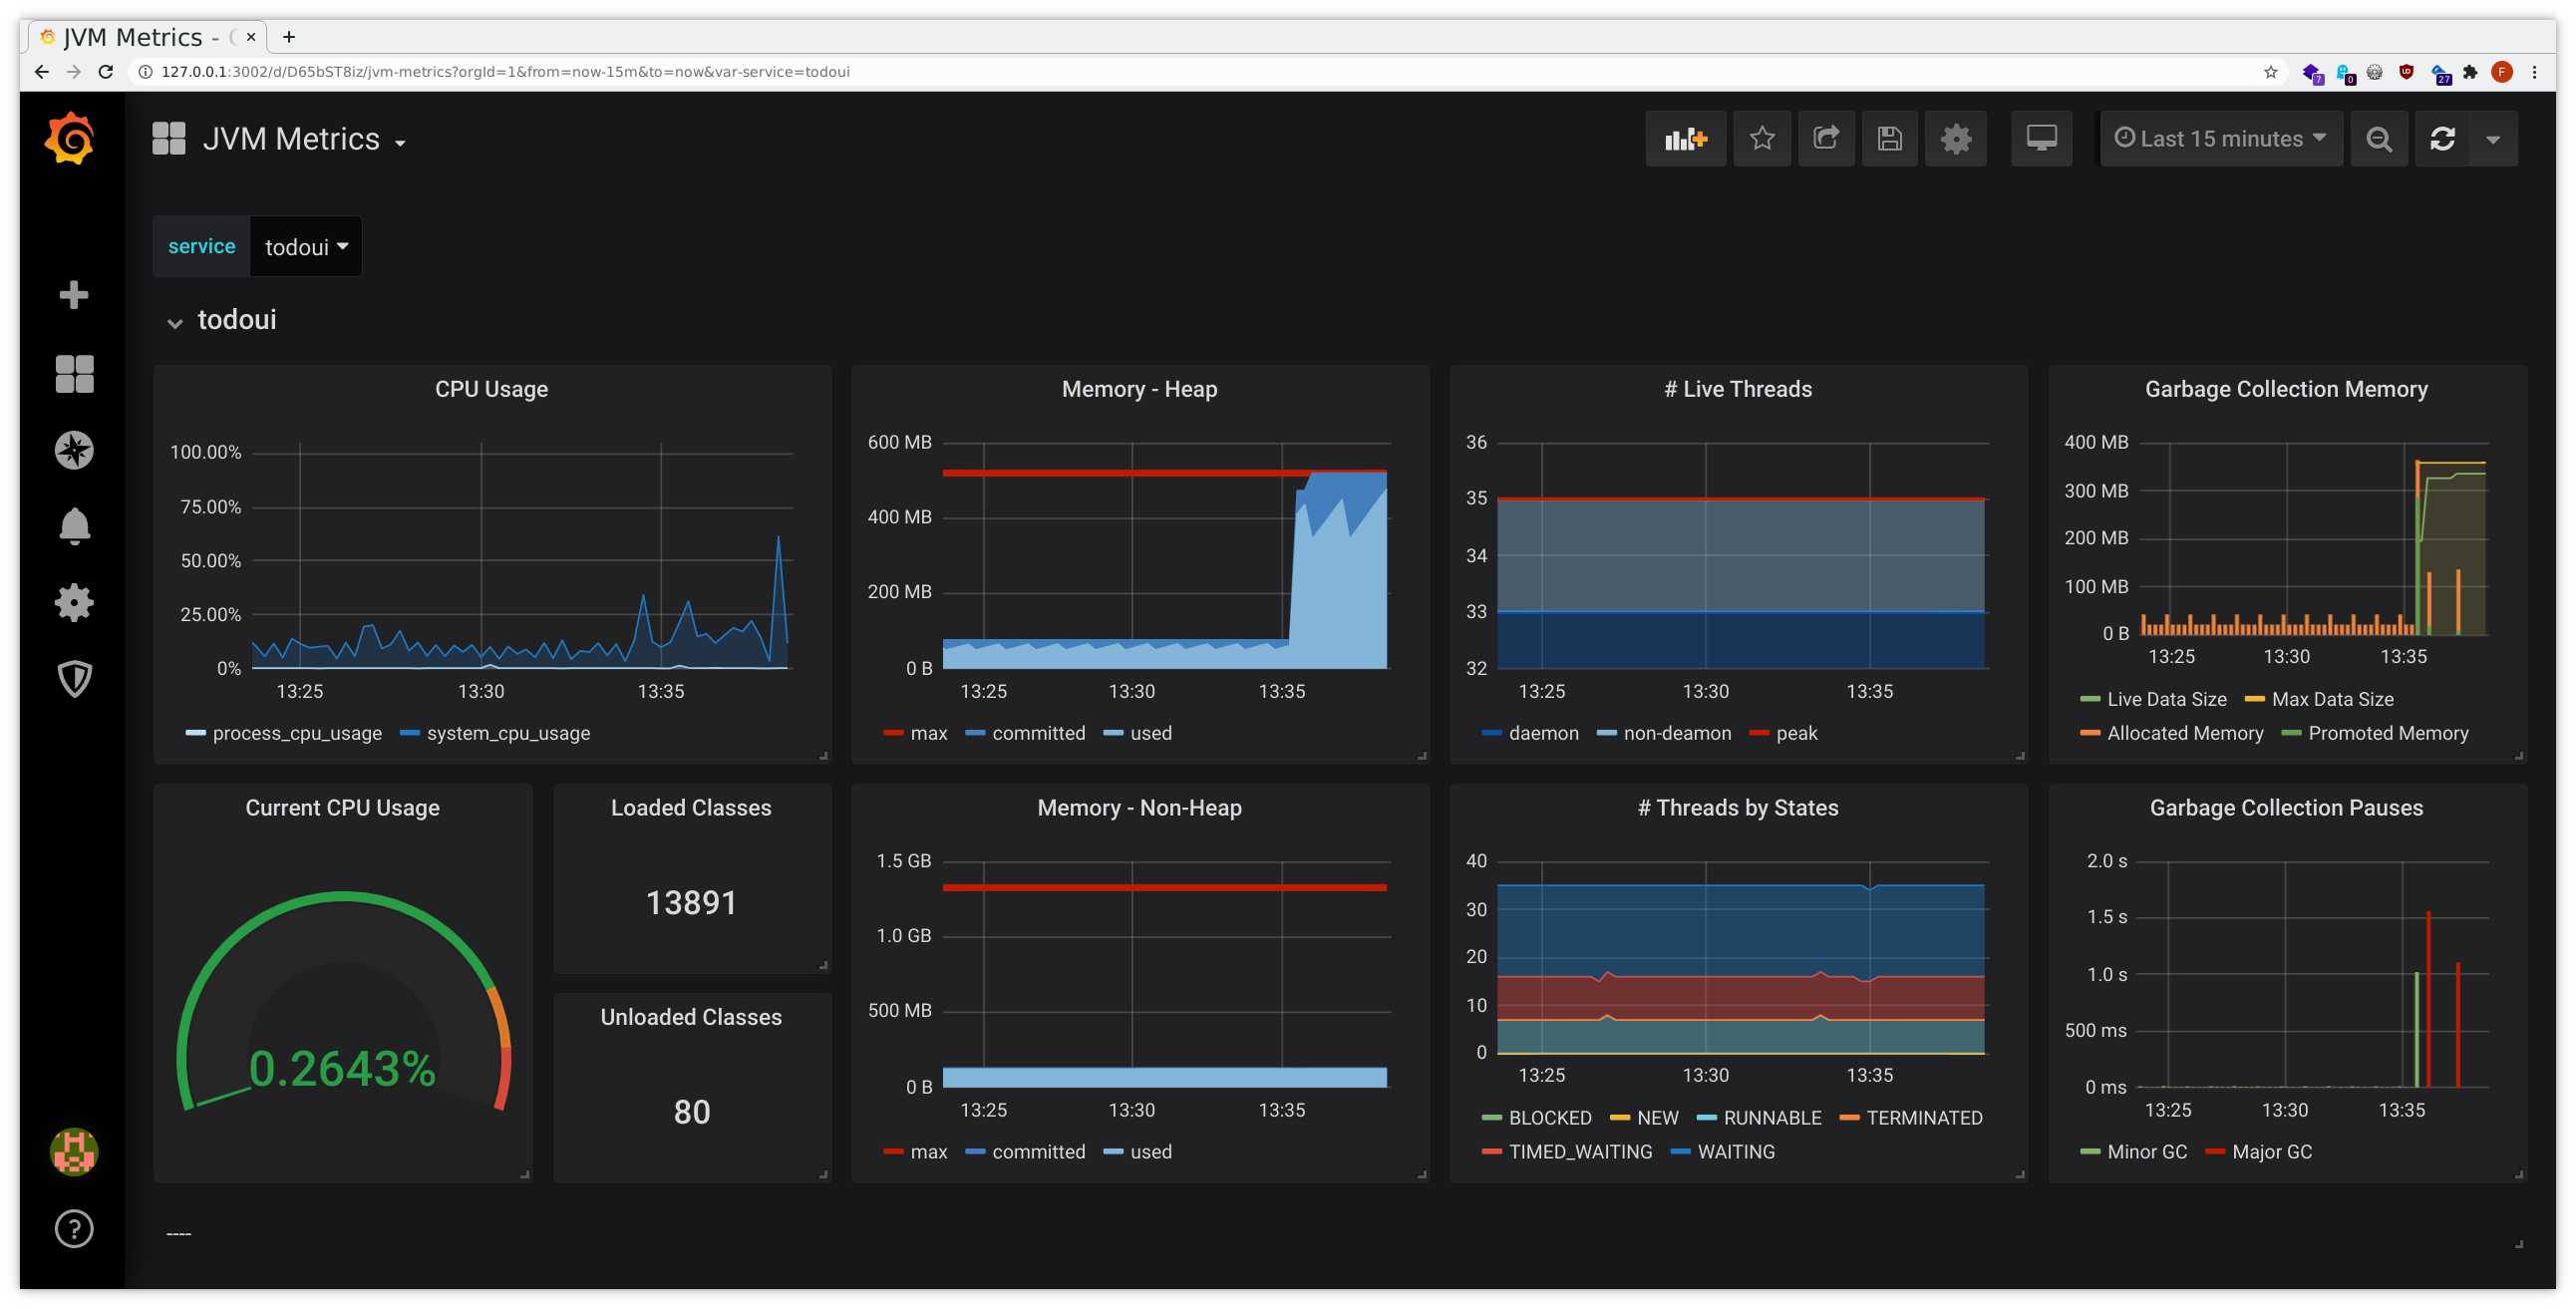

There was a surge in memory usage, with the JVM even running into pauses while attempting major garbage collection, and the Pod ending up consuming way more memory than it has initially requested for normal use, slowly approaching the predefined hard memory limit. Without Ocelot we’d only have the latter graph, which already indicates some problem, but the additional introspection provided by Ocelot allows for better insight.
Of course, in this case it became rather obvious that something had happened. However, in a real-world scenario such a memory leak might be distinctly less obvious.
Now let’s make the situation worse. In the separate terminal call the /leak endpoint repeatedly as follows:
LOADBALANCER_IP=$(kubectl get svc todoui -o jsonpath="{.status.loadBalancer.ingress[0].ip}"); echo $LOADBALANCER_IP
CURL="curl --silent --location"
while sleep 1; do
    $CURL http://$LOADBALANCER_IP:8090/leak
    date
done
You will notice that most of the time this will not yield any output beside the datetime stamp. What is happening here?
The dashboards that we had used above might start showing gaps, so something is not working correctly. But what exactly is it?
The Prometheus monitoring system has some predefined helpful alerts. We can query its raw alert state via the HTTP API like this:
curl --silent https://zwtj1.prometheus.cloudtrainings.online/api/v1/alerts |
    jq ".data.alerts[] | select(.labels.namespace==\"$NAMESPACE\") | .annotations.description"
which will eventually yield output similar to this
"Pod <your_namespace>/todoui-0-3-86676ff4c4-t9sj9 (todoui) is in waiting state (reason: \"CrashLoopBackOff\") on cluster ."
"Pod <your_namespace>/todoui-0-3-86676ff4c4-m4ktn has been in a non-ready state for longer than 15 minutes on cluster ."
"Pod <your_namespace>/todoui-0-3-86676ff4c4-t9sj9 has been in a non-ready state for longer than 15 minutes on cluster ."
"Pod <your_namespace>/todoui-0-3-86676ff4c4-v2zqx has been in a non-ready state for longer than 15 minutes on cluster ."
"Deployment <your_namespace>/todoui-0-3 has not matched the expected number of replicas for longer than 15 minutes on cluster ."
"HPA <your_namespace>/todoui-0-3 has been running at max replicas for longer than 15 minutes on cluster ."
"Probe failed\n  VALUE = 0\n  LABELS: map[__name__:probe_success instance:todoui.<your_namespace>:8090 job:probe/<your_namespace>/todoui namespace:<your_namespace>]"
"92.27% throttling of CPU in namespace <your_namespace> for container todoui in pod todoui-0-3-86676ff4c4-t9sj9 on cluster ."
(Of course we could get the same data via the Prometheus web interface as given above , but the standard web interface makes it somewhat hard to filter the output, and the more convenient Prometheus alertmanager has not been configured in our setup for sending out notifications or displaying filtered results, so that’s the best we have for now. Feel free to drop the "| .annotations.message" filter (or all filters altogether) from our jq call above to get more data.)
Let’s cancel the loop calling the /leak endpoint, we have caused enough stress for now, and check the state:
- that some targets are down we have already noticed when our curl loop did not yield the expected output
- a brief
kubectl get powill confirm that there indeed had been Pod restarts - the desired state of our Deployment - in conjunction with our HPA - cannot be fulfilled
- CPU throttling took place
So much about “what has happened”. But why? And why have some container(s) remained in a non-ready state?
All in all this illustrates how the combination of cluster-wide Prometheus monitoring with its predefined set of rules and alerts and the metrics and dashboards provided by inspectIT Ocelot allow debugging the behavior of our application in a rather pathological scenario.
Of course inspectIT Ocelot allows for gathering many more custom metrics and a lot more instrumentation , but even with its default setting it provides many valuable insights. See this blog post for some more details.