OpenTelemetry
Intro
- an observability framework and toolkit designed for creating and managing telemetry data, including traces , metrics , and logs .
- vendor- and tool-agnostic, meaning it can be used with a variety of observability backends, including open-source tools such as Jaeger and Prometheus , as well as commercial offerings.
- not an observability backend like Jaeger, Prometheus, or other commercial vendors.
- focused on the generation, collection, management and export of telemetry. One of OpenTelemetry’s main objectives is to make it easy for you to instrument your applications or systems, regardless of the language, infrastructure, or runtime environment used. Storage and visualization of telemetry is intentionally left to other tools.
So, unlike in the preceding chapters, we are going to use one generic tool to fulfill the tasks that have been handled by various individual tools before, as OpenTelemetry consists of the following major components:
- A specification for all components
- A standard protocol that defines the shape of telemetry data
- Semantic conventions that define a standard naming scheme for common telemetry data types
- APIs that define how to generate telemetry data
- Language SDKs that implement the specification, APIs, and export of telemetry data
- A library ecosystem that implements instrumentation for common libraries and frameworks
- Automatic instrumentation components that generate telemetry data without requiring code changes
- The OpenTelemetry Collector , a proxy that receives, processes, and exports telemetry data
- Various other tools, such as the OpenTelemetry Operator for Kubernetes , OpenTelemetry Helm Charts , and community assets for FaaS
OpenTelemetry is used by a wide variety of libraries, services and apps that have OpenTelemetry integrated to provide observability by default.
OpenTelemetry is supported by numerous vendors , many of whom provide commercial support for OpenTelemetry and contribute to the project directly.
History
OpenTelemetry is a Cloud Native Computing Foundation (CNCF) project that is the result of a merger between two prior projects, OpenTracing and OpenCensus . Both of these projects were created to solve the same problem: the lack of a standard for how to instrument code and send telemetry data to an observability backend. As neither project was fully able to solve the problem independently, they merged to form OpenTelemetry and combine their strengths while offering a single solution.
OpenTelemetry Operator
We are going to use the opentelemetry-operator here, another example of the operator design pattern .
This operator manages:
- the OpenTelemetry Collector , i.e. a proxy that receives, processes, and exports telemetry data
- auto-instrumentation of the workloads using OpenTelemetry instrumentation libraries
The proxy can be injected into existing workloads, or it could be deployed on its own. We will investigate these use-cases further down.
Auto-instrumentation can also be injected into workloads, with the result of this instrumentation then being handled by an OpenTelemetry Collector. We will check out this functionality as well.
Postgres
Let’s now apply this in order to retrieve some metrics from our database.
For that, we are going to attach a sidecar container again. Unlike before in Gather and inspect Postgres metrics , however, this sidecar will not be statically defined within the Deployment specification, but it will be auto-injected via the OpenTelemetry Operator by creating a
Postgres OpenTelemetryCollector
This contains the basic building blocks for making application metrics available:
- a collector image to execute
- credentials for receiving them, in form of environment variables referencing Secrets/ConfigMaps
- a receiver configuration specifying where the data actually can be queried
- an exporter to make the metrics consumable
- and some binding glue to ease the processing
Now, let’s put this to create a file postgres-otelcollector.yaml containing:
apiVersion: opentelemetry.io/v1beta1
kind: OpenTelemetryCollector
metadata:
  name: postgresdb
spec:
  mode: sidecar
  env:
    - name: POSTGRESQL_USERNAME
      valueFrom:
        secretKeyRef:
          name: db-security
          key: db.user.name
    - name: POSTGRESQL_PASSWORD
      valueFrom:
        secretKeyRef:
          name: db-security
          key: db.user.password
    - name: POSTGRESQL_DATABASE
      valueFrom:
        configMapKeyRef:
          name: postgres-config
          key: postgres.db.name
  config:
    receivers:
      postgresql:
        endpoint: localhost:5432
        transport: tcp
        username: ${env:POSTGRESQL_USERNAME}
        password: ${env:POSTGRESQL_PASSWORD}
        databases:
          - ${env:POSTGRESQL_DATABASE}
        collection_interval: 30s
        tls:
          insecure: true

    processors:
      memory_limiter:
        check_interval: 1s
        limit_percentage: 75
        spike_limit_percentage: 15
      batch:
        send_batch_size: 10000
        timeout: 10s

    exporters:
      debug: {}
      prometheus:
        endpoint: "0.0.0.0:8889"

    service:
      pipelines:
        metrics:
          receivers: [postgresql]
          processors: [memory_limiter, batch]
          exporters: [debug, prometheus]
There are a lot more options to configure a Collector in general and the postgresqlreceiver and the prometheusexporter in particular, but let’s start simple.
The mode: sidecar in this specification tells the Operator to not deploy this Collector on its own. This has some
implications as we are going to see now.
Let’s apply this specification via
kubectl apply -f postgres-otelcollector.yaml
check via kubectl get otelcol,svc,cm,po and you will find it creates a ConfigMap containing the configuration from
above, and also some Services that do not resolve to actual workloads, as no new Pods have been created. This was due to
this mode: sidecar from above.
Postgres Sidecar Injection
But how to get this Collector running now, i.e. how to attach the Sidecar? Well, this is done by dynamically injecting
it into our database. So edit postgres-storage.yaml and ensure the following structure is in there:
spec:
  template:
    metadata:
      annotations:
sidecar.opentelemetry.io/inject: "postgresdb"You can test your changes via kubectl diff -f postgres-storage.yaml and then apply them via
kubectl apply -f postgres-storage.yaml.
This will recreate your database Pod, keeping all the data intact if you have finished the exercise Deploy Postgres backed by PVC . In fact, it is heavily recommended to have finished the main flow of the exercises, as we are going to make use of quite some of the structures introduced therein.
Please note that recreating the database Pod might experience a slight delay due to
Multi-Attach error for volume "pvc-..." Volume is already used by pod(s) postgresdb-...as seen via kubectl describe po postgresdb-....
Once the Pod is running again, take a closer look at this description:
$ kubectl describe po postgresdb-...
[...]
Labels:           app=postgresdb
                  pod-template-hash=644c4d66bb
                  sidecar.opentelemetry.io/injected=<your_namespace>.postgresdb
                  tier=database
Annotations:      sidecar.opentelemetry.io/inject: postgresdb
[...]
Containers:
[...]
  otc-container:
    Container ID:  containerd://ab9443c379961d132a6bc528ad08be595f7002392217474bdfc5f2e6855bb3de
    Image:         ghcr.io/open-telemetry/opentelemetry-collector-releases/opentelemetry-collector-contrib:0.126.0
    Image ID:      ghcr.io/open-telemetry/opentelemetry-collector-releases/opentelemetry-collector-contrib@sha256:973747f78266a8ffec428417727e6b704559e9a30e4be8c1cca2899facd68689
    Ports:         8888/TCP, 8889/TCP
[...]
and then listing the config as specified in the Collector. kubectl get po will also indicate that we have an
additional sidecar container in this Pod now.
And what did this new container do so far? Let’s check via
kubectl logs deployments/postgresdb -c otc-container | head -n 10
yielding something along
2025-05-19T13:54:02.987Z        info    service@v0.126.0/service.go:199 Setting up own telemetry...     {"resource": {}}
2025-05-19T13:54:02.988Z        info    builders/builders.go:26 Development component. May change in the future.        {"resource": {}, "otelcol.component.id": "debug", "otelcol.component.kind": "exporter", "otelcol.signal": "metrics"}
2025-05-19T13:54:02.988Z        info    memorylimiter@v0.126.0/memorylimiter.go:149     Using percentage memory limiter {"resource": {}, "otelcol.component.kind": "processor", "total_memory_mib": 64302, "limit_percentage": 75, "spike_limit_percentage": 15}
2025-05-19T13:54:02.988Z        info    memorylimiter@v0.126.0/memorylimiter.go:74      Memory limiter configured       {"resource": {}, "otelcol.component.kind": "processor", "limit_mib": 48226, "spike_limit_mib": 9645, "check_interval": 1}
2025-05-19T13:54:02.989Z        warn    postgresqlreceiver@v0.126.0/scraper.go:87       Feature gate receiver.postgresql.separateSchemaAttr is not enabled. Please see the README for more information: https://github.com/open-telemetry/opentelemetry-collector-contrib/blob/v0.88.0/receiver/postgresqlreceiver/README.md   {"resource": {}, "otelcol.component.id": "postgresql", "otelcol.component.kind": "receiver", "otelcol.signal": "metrics"}
2025-05-19T13:54:02.990Z        info    service@v0.126.0/service.go:266 Starting otelcol-contrib...     {"resource": {}, "Version": "0.126.0", "NumCPU": 8}
2025-05-19T13:54:02.990Z        info    extensions/extensions.go:41     Starting extensions...  {"resource": {}}
2025-05-19T13:54:02.990Z        info    service@v0.126.0/service.go:289 Everything is ready. Begin running and processing data. {"resource": {}}
2025-05-19T13:54:12.991Z        info    Metrics {"resource": {}, "otelcol.component.id": "debug", "otelcol.component.kind": "exporter", "otelcol.signal": "metrics", "resource metrics": 4, "metrics": 18, "data points": 32}
2025-05-19T13:54:42.994Z        info    Metrics {"resource": {}, "otelcol.component.id": "debug", "otelcol.component.kind": "exporter", "otelcol.signal": "metrics", "resource metrics": 4, "metrics": 19, "data points": 33}
Postgres Sidecar Metrics
So, the Sidecar container is running the previously specified image, with the previously specified configuration, and it claims to provide some metrics now. Let’s check whether these metrics are really there.
As this otc-container doesn’t have a shell available at all, and the postgres image does not have curl installed, let’s just install it now to ease things. We will explore accessing these metrics via port-forwarding later on, though.
And if you dislike installing things into the database container: remember you can always just kill the Pod, and it will recreate the container from its specified image, thus removing the additional programs we are now about to install via
kubectl exec deployment/postgresdb -c postgresdb -- \
  sh -c 'apt --quiet update && apt --quiet --yes install curl && curl --silent http://localhost:8889/metrics' \
  | grep 'postgresql_database_count'
which should yield something along the lines of
[...]
# HELP postgresql_database_count Number of user databases.
# TYPE postgresql_database_count gauge
postgresql_database_count 1
and then let’s execute also
kubectl exec deployment/postgresdb -c postgresdb -- \
  curl --silent http://localhost:8888/metrics \
  | grep 'otelcol_process_uptime_seconds_total'
which should yield something along the lines of
# HELP otelcol_process_uptime_seconds_total Uptime of the process [alpha]
# TYPE otelcol_process_uptime_seconds_total counter
otelcol_process_uptime_seconds_total{otel_scope_name="go.opentelemetry.io/collector/service",otel_scope_version=""} 8590.996858164
So yes, we do have some new metrics available, both some for the database on port 8889 as specified above and also some for the OpenTelemetry Collector on port 8888 which had been auto-provided without requiring explicit configuration.
Adjust (or omit) the grep to view more data. Now how to tell our Prometheus to scrape that newly available metrics source?
First, let’s expose the ports on our postgres ClusterIP Service, and also consolidate the adjustments done on-the-fly in the Istio chapter :
- add the port 8888 named http-metrics-otel
- add the port 8889 named http-metrics-app
- name the postgres port 5432 appropriately
- and insert the Service label
Edit your local postgres-service.yaml accordingly.
When you are confident your adjustments are complete (feel free to check the solution given above, and also to check the
changes via kubectl diff -f postgres-service.yaml), apply it:
kubectl apply -f postgres-service.yaml
This should not lead to any Service disruptions. Now tell our Prometheus operator where to find these metrics by using a
ServiceMonitor resource, telling where to look and how often. So create a file postgres-metrics.yaml:
apiVersion: monitoring.coreos.com/v1
kind: ServiceMonitor
metadata:
  name: postgresdb
  labels:
    # Label to tell prometheus to select this ServiceMonitor to scrape metrics
    release: monitoring
spec:
  endpoints:
    - interval: 30s
      port: http-metrics-otel
    - interval: 30s
      port: http-metrics-app
  selector:
    matchLabels:
      app: postgresdb
Apply this file via kubectl apply -f postgres-metrics.yaml, and after a short while Prometheus will collect the
metrics. You can verify their presence via
Exercise - Access monitoring data via web interface
.
todoapp
todoapp OpenTelemetryCollector
Well, what worked with our database could be applied to our todoui and our todobackend as well, that is:
- specify a sidecar
- attach that via dynamic injection
- query metrics from newly exposed ports
However, the situation here somewhat differs: we have two rather similar workloads that both run Java code from the same framework, so attaching a full and identical sidecar to each of them feels wasteful and redundant. Instead, we can consolidate our Collector to be required only once, in form of a Deployment, and then later configure some auto-instrumentation for our workloads to be forwarded to that Deployment.
So, let’s create a file todoapp-otelcollector.yaml containing:
apiVersion: opentelemetry.io/v1beta1
kind: OpenTelemetryCollector
metadata:
  name: todoapp
spec:
  mode: deployment
  deploymentUpdateStrategy:
    type: Recreate
    rollingUpdate: null
  config:
    receivers:
      otlp:
        protocols:
          grpc:
            endpoint: 0.0.0.0:4317

    processors:
      memory_limiter:
        check_interval: 1s
        limit_percentage: 75
        spike_limit_percentage: 15
      batch:
        send_batch_size: 10000
        timeout: 10s

    exporters:
      debug: {}
      prometheus:
        endpoint: "0.0.0.0:8889"
      otlp/jaeger:
        endpoint: "jaeger-collector.logging.svc:4317"
        tls:
          insecure: true

    service:
      pipelines:
        traces:
          receivers: [otlp]
          processors: [memory_limiter, batch]
          exporters: [debug, otlp/jaeger]
        metrics:
          receivers: [otlp]
          processors: [memory_limiter, batch]
          exporters: [debug, prometheus]
This is still similar in concept to what we have seen above for the Postgres OpenTelemetryCollector , now containing:
- a generic OTLP receiver , and we yet need to see where this data will be sent from
- a prometheusexporter for metrics
- a generic OTLP exporter sending traces to Jaeger
Apply this file via kubectl apply -f todoapp-otelcollector.yaml
and check via kubectl get otelcol,svc,cm,po what will be created by that:
- a ConfigMap containing the above configuration
- a Deployment
todoapp-collectorwith a single Pod referencing this ConfigMap - several Services that map to this Pod
This matches the mode: deployment from above.
We can already check whether this Deployment provides any metrics. As there is no shell available at all in the collector container, we cannot test from within the container. But we can check via port-forwarding.
Execute kubectl get svc for viewing the available ports and then kubectl port-forward service/todoapp-collector 8889
for creating a port-forwarding. In another shell execute curl --silent http://localhost:8889/metrics which should
succeed but remain empty for now, as nothing provides any application metrics yet. Stop the port-forwarding by pressing
CTRL+C in its shell window.
And then also execute kubectl port-forward service/todoapp-collector-monitoring 8888 for creating a port-forwarding.
In another shell execute curl --silent http://localhost:8888/metrics | grep otelcol_process_uptime_seconds_total which should yield
something along the lines of
# HELP otelcol_process_uptime_seconds_total Uptime of the process [alpha]
# TYPE otelcol_process_uptime_seconds_total counter
otelcol_process_uptime_seconds_total{otel_scope_name="go.opentelemetry.io/collector/service",otel_scope_version=""} 4267.684622311
Stop the port-forwarding by pressing CTRL+C in its shell window.
todoapp ServiceMonitor
So yes, the OpenTelemetry Collector already provides some metrics. But it doesn’t have any application data yet. Still, we can tell Prometheus already to collect all available metrics.
Create a file todoapp-metrics.yaml:
apiVersion: monitoring.coreos.com/v1
kind: ServiceMonitor
metadata:
  name: todoapp-otel
  labels:
    # Label to tell prometheus to select this ServiceMonitor to scrape metrics
    release: monitoring
spec:
  endpoints:
    - interval: 30s
      port: monitoring
  selector:
    matchLabels:
      app.kubernetes.io/name: todoapp-collector-monitoring
---
apiVersion: monitoring.coreos.com/v1
kind: ServiceMonitor
metadata:
  name: todoapp-apps
  labels:
    # Label to tell prometheus to select this ServiceMonitor to scrape metrics
    release: monitoring
spec:
  endpoints:
    - interval: 30s
      port: prometheus
  selector:
    matchLabels:
      app.kubernetes.io/name: todoapp-collector
      operator.opentelemetry.io/collector-service-type: base
Apply this file via kubectl apply -f todoapp-metrics.yaml, and after a short while Prometheus will collect the
metrics. You can verify their presence via
Exercise - Access monitoring data via web interface
.
todoapp Instrumentation
Now to the question of how we receive the data that is sent to this collector, i.e. the data about/from our applications.
In order to gain more insight into our applications, we need some kind of interface into it. One way would be if the application would provide such data by itself, i.e. once we have adjusted the code via instrumentation .
Another way would be to rebuild our application to contain a data exporter, possibly via an agent tied to our application. This is what we did in the Gather and inspect application metrics exercise using Novatec’s inspectIT Ocelot , but this required utilizing specially built images.
Now we go one step further, using the facilities the OpenTelemetry Operator for Kubernetes provides, via Zero-code Instrumentation Java Agent Configuration .
The basic configuration is rather straightforward. Create a file todoapp-instrumentation.yaml containing
apiVersion: opentelemetry.io/v1alpha1
kind: Instrumentation
metadata:
  name: todoapp
spec:
  exporter:
    endpoint: http://todoapp-collector:4318
  propagators:
    - tracecontext
    - baggage
  sampler:
    type: parentbased_traceidratio
    argument: "1"
  java:
    image: ghcr.io/open-telemetry/opentelemetry-operator/autoinstrumentation-java:2.15.0
This just configures what data shall be gathered and how much of it.
Let’s apply it via kubectl apply -f todoapp-instrumentation.yaml, which will not yet trigger any further action.
todobackend injection
To actually enable data gathering, we will need to tell the operator which workloads should be handled. This is done via adding a specific annotation again.
So, make sure the following structure is present in your todobackend.yaml:
spec:
  template:
    metadata:
      annotations:
        instrumentation.opentelemetry.io/inject-java: "true"
        instrumentation.opentelemetry.io/container-names: "todoapp"
And we also should ensure that we can easily distinguish our applications, as all participants run their workloads with the exact same names, so we should tell OpenTelemetry to append our namespace not only to the metadata but also to the service name. This is done simply by setting an environment variable called OTEL_SERVICE_NAME.
Once you apply this file via kubectl apply -f todobackend.yaml our todobackend will restart. And once it has
restarted, let’s check what the operator has done.
First, what is running now? Check via kubectl logs deployments/todobackend -c todobackend | head -n 11.
This should yield output along
Picked up JAVA_TOOL_OPTIONS:  -javaagent:/otel-auto-instrumentation-java-todobackend/javaagent.jar
OpenJDK 64-Bit Server VM warning: Sharing is only supported for boot loader classes because bootstrap classpath has been appended
[otel.javaagent 2025-05-15 15:04:40:956 +0000] [main] INFO io.opentelemetry.javaagent.tooling.VersionLogger - opentelemetry-javaagent - version: 2.15.0

  .   ____          _            __ _ _
 /\\ / ___'_ __ _ _(_)_ __  __ _ \ \ \ \
( ( )\___ | '_ | '_| | '_ \/ _` | \ \ \ \
 \\/  ___)| |_)| | | | | || (_| |  ) ) ) )
  '  |____| .__|_| |_|_| |_\__, | / / / /
 =========|_|==============|___/=/_/_/_/
 :: Spring Boot ::                (v3.1.1)
So apparently a Java agent for auto-instrumentation has been added.
Do we see any references to this in the Pod description?
Execute kubectl describe po todobackend-..., which should show
[...]
Annotations:      instrumentation.opentelemetry.io/container-names: todoapp
                  instrumentation.opentelemetry.io/inject-java: true
[...]
Init Containers:
  opentelemetry-auto-instrumentation-java:
    Container ID:  containerd://380ba2cc7d547f9e85bfcd223ff5c879045b20fdd4a8ec52b3ee6227e709c513
    Image:         ghcr.io/open-telemetry/opentelemetry-operator/autoinstrumentation-java:2.15.0
[...]
    Command:
      cp
      /javaagent.jar
      /otel-auto-instrumentation-java/javaagent.jar
[...]
    Mounts:
      /otel-auto-instrumentation-java from opentelemetry-auto-instrumentation-java (rw)
[...]
Containers:
  todobackend:
    Container ID:   containerd://a37349a6542884a7660cb7f8f900cd9f4964f4bd7d7a546d059f1c18e9868759
    Image:          novatec/technologyconsulting-containerexerciseapp-todobackend:v0.2
[...]
    Environment:
      OTEL_NODE_IP:                             (v1:status.hostIP)
      OTEL_POD_IP:                              (v1:status.podIP)
      SPRING_PROFILES_ACTIVE:                  prod
      POSTGRES_HOST:                           postgresdb
      NAMESPACE_HELPER:                        <your_namespace> (v1:metadata.namespace)
      OTEL_SERVICE_NAME:                       todobackend.$(NAMESPACE_HELPER)
      JAVA_TOOL_OPTIONS:                        -javaagent:/otel-auto-instrumentation-java-todobackend/javaagent.jar
      OTEL_EXPORTER_OTLP_ENDPOINT:             http://todoapp-collector:4318
      OTEL_RESOURCE_ATTRIBUTES_POD_NAME:       todobackend-5b45b95ff7-nmq58 (v1:metadata.name)
      OTEL_RESOURCE_ATTRIBUTES_NODE_NAME:       (v1:spec.nodeName)
      OTEL_PROPAGATORS:                        tracecontext,baggage
      OTEL_TRACES_SAMPLER:                     parentbased_traceidratio
      OTEL_TRACES_SAMPLER_ARG:                 1
      OTEL_RESOURCE_ATTRIBUTES:                k8s.container.name=todobackend,k8s.deployment.name=todobackend,k8s.namespace.name=<your_namespace>,k8s.node.name=$(OTEL_RESOURCE_ATTRIBUTES_NODE_NAME),k8s.pod.name=$(OTEL_RESOURCE_ATTRIBUTES_POD_NAME),k8s.replicaset.name=todobackend-5b45b95ff7,service.instance.id=<your_namespace>.$(OTEL_RESOURCE_ATTRIBUTES_POD_NAME).todobackend,service.namespace=<your_namespace>,service.version=v0.2
    Mounts:
      /otel-auto-instrumentation-java-todobackend from opentelemetry-auto-instrumentation-java (rw)
[...]
Volumes:
[...]
  opentelemetry-auto-instrumentation-java:
    Type:        EmptyDir (a temporary directory that shares a pod's lifetime)
    Medium:
    SizeLimit:   200Mi
[...]
So the operator has acted upon our inject-java annotation by
- adding an initContainer which contains the Java agent
- copying this agent to a temporary volume bound to the Pod
- setting some environment variables to load the agent via
JAVA_TOOL_OPTIONS - also setting some environment variables for configuring the agent
This is all done on the Pod level, whereas the Deployment specification remains unchanged.
Feel free to verify via kubectl diff -f todobackend.yaml.
todoui injection
Let’s just quickly apply the same adjustments to our todoui as well, before we start checking the results. That is, make
sure the same inject-java annotation is present at the appropriate spot, and apply that.
todoapp Deployment Metrics
Now let’s recheck what metrics our todoapp Collector can provide. Again, via port-forwarding as follows.
Execute kubectl get svc for viewing the ports and then kubectl port-forward service/todoapp-collector 8889 for
creating a port-forwarding. In another shell window execute
curl --silent http://localhost:8889/metrics | grep application_ready_time_seconds
which should yield something along the lines of
# HELP application_ready_time_seconds Time taken (ms) for the application to be ready to service requests
# TYPE application_ready_time_seconds gauge
application_ready_time_seconds{instance="<your_namespace>.todobackend-5bc4bc96dd-87f2h.todobackend",job="todobackend.<your_namespace>",main_application_class="io.novatec.todobackend.TodobackendApplication"} 10.953
application_ready_time_seconds{instance="<your_namespace>.todoui-0-3-95579df6d-gfftt.todoui",job="todoui.<your_namespace>",main_application_class="io.novatec.todoui.TodouiApplication"} 22.205
Please note that it might take some time before the magic has worked in the background.
Once you get such output stop the port-forwarding by pressing CTRL+C in its shell window.
So yes, apparently the Collector now receives data for both of todobackend and todoui.
Collector modes
With Postgres we have deployed the Collector as a Sidecar, and with the todoapp with a Deployment. Both have their distinct advantages and disadvantages:
- A Sidecar allows close bundling to an application, which might be required for accessing via localhost or accessing the same storage, as that is something which all containers in a Pod share by design.
- A Deployment consolidates commonly found settings into a single Pod, saving on duplication and thus redundancy.
Further modes are available, though:
- A StatefulSet would allow safely scaling the amount of Collectors, allowing to distribute load while retaining an individual identity per running Pod, which is something that a Deployment cannot provide and which might lead to data duplication otherwise.
- A DaemonSet would allow creating a Collector Pod on each cluster node, allowing to also gather node metrics and container logs from there.
Here we kept things simple, though, only dealing with metrics and traces and ignoring logs for the time being.
If you want, you could try consolidating the OpenTelemetryCollectors into one. After all, we can query our database from outside its Pod, too, so there is no need to have a separate Sidecar injected into it.
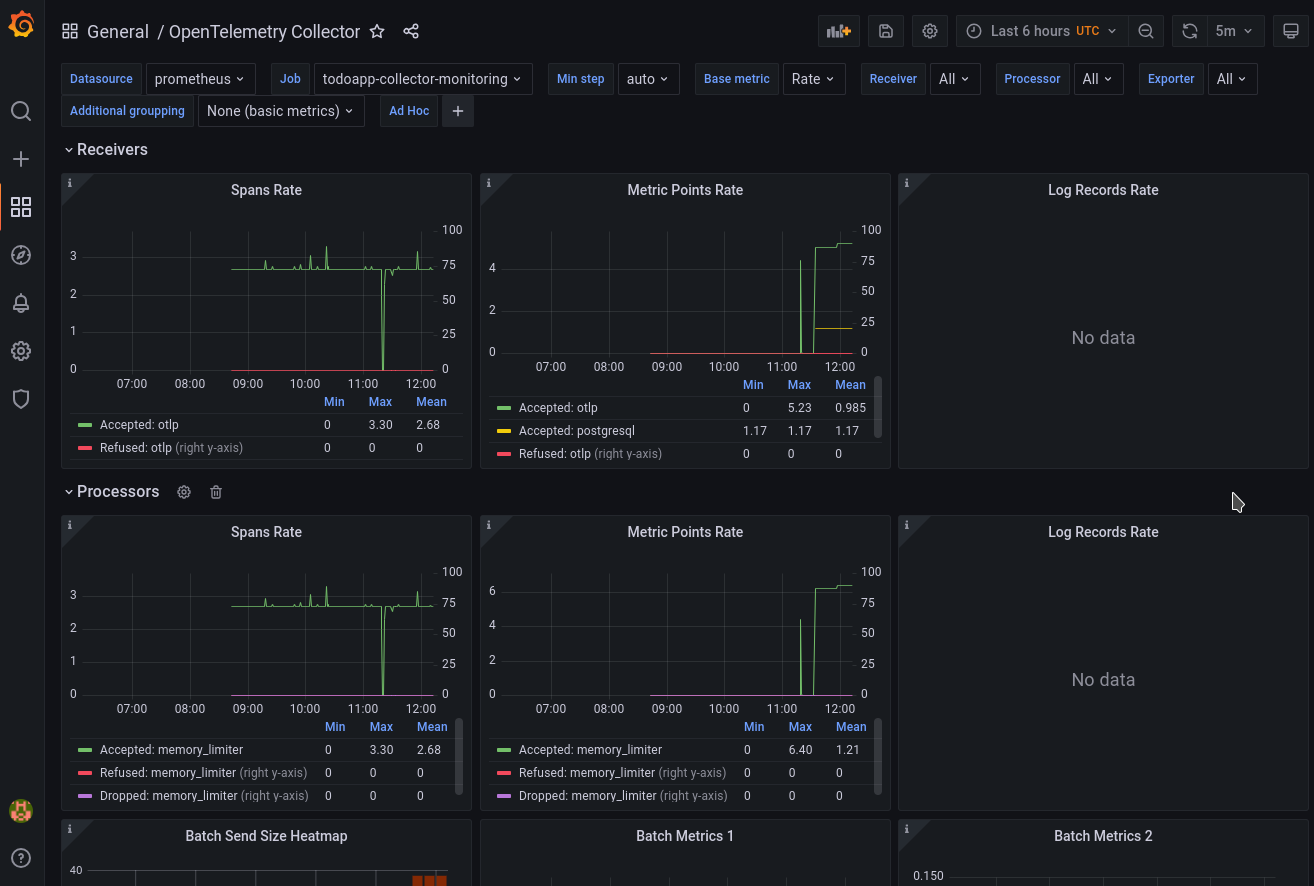
Grafana Dashboard
Unfortunately, as of now there aren’t that many nice Grafana Dashboards available to visualize the collected metrics. Still, some visualization exists:
- connect to Grafana as stated in Access monitoring data via web interface
- check the OpenTelemetry Collector dashboard
- here a sample screenshot
Jaeger UI
Similarly
- connect to Jaeger as stated in Access the Jaeger web interface
- drill down into the traces specific to your individual todoui
- here a sample screenshot
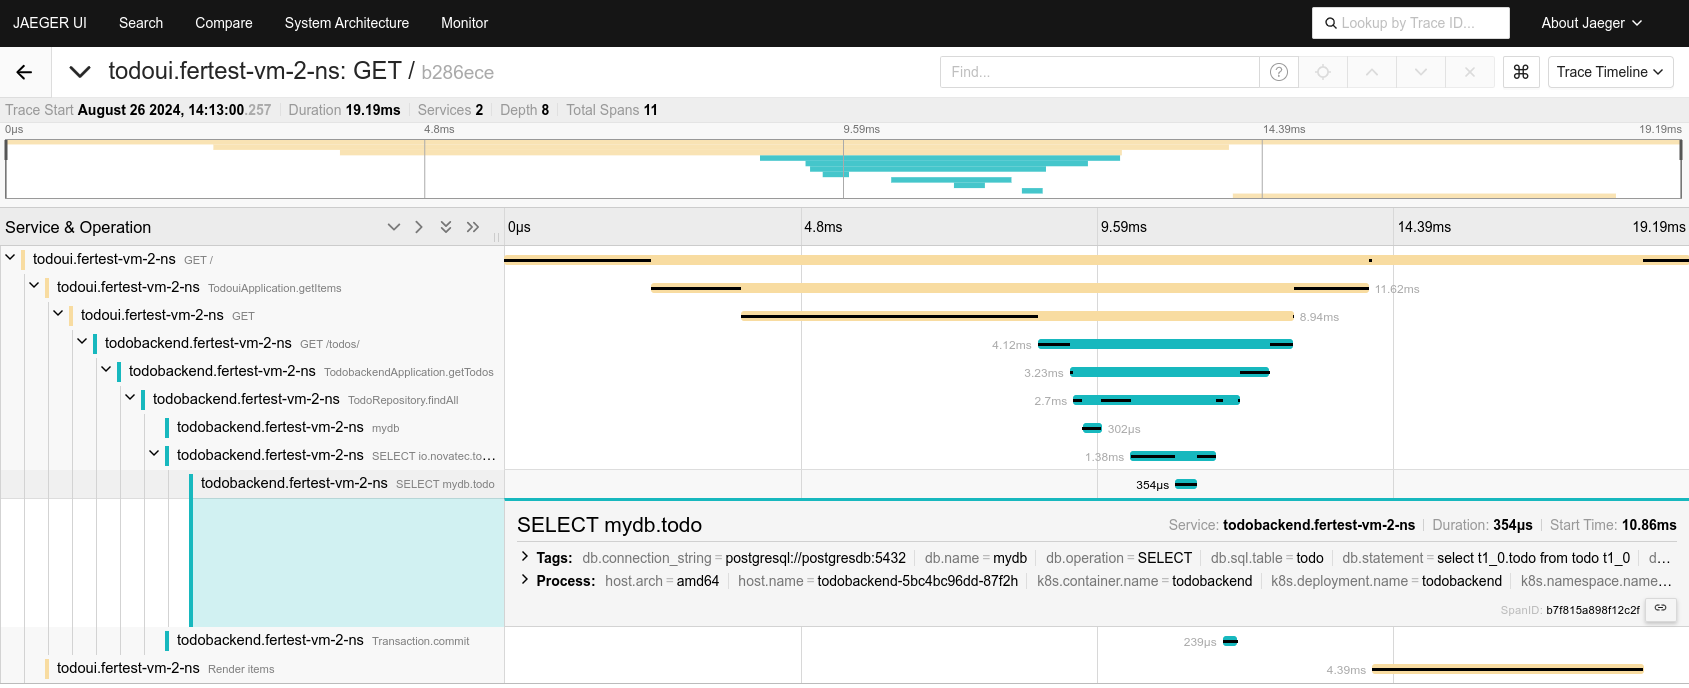
As you can see, the traces allow insight down to the SQL query level. Nice.
Outlook
OpenTelemetry allows us to easily collect various metrics and traces from our application stack, facilitated by the opentelemetry-operator :
Injection and Auto-instrumentation require only minimal changes, and the Collector takes over all incoming data, making it available to our monitoring backends.
Please note, however, that this only scratches on the surface. Specific application instrumentation would provide more control, at the cost of more developer effort to take. And there are lots of tiny details that could make all the difference when handling an application.
Ask your local service partner for a general OpenTelemetry training. :-)