Linkerd
Linkerd is fully open source, licensed under Apache v2 , and is a Cloud Native Computing Foundation incubating project. Linkerd is the very first Service Mesh project and the project that gave birth to the term service mesh itself, cf. The Service Mesh: What Every Software Engineer Needs to Know about the World’s Most Over-Hyped Technology , and it is developed in the open in the Linkerd GitHub organization .
Buoyant , the original creators of Linkerd, offer support, training, and enterprise products around the open-source Linkerd tool.
Linkerd has three basic components: a data plane (with proxies written in Rust and specialized for Linkerd in order to be as small, lightweight, and safe as possible), a control plane, and a UI. You run Linkerd by:
- Installing the CLI on your local system (already done for us)
- Installing the control plane into your cluster (already done for us)
- Adding your services to Linkerd’s data plane (will be done next)
Once a service is running with Linkerd, you can use Linkerd’s UI to inspect and manipulate it.
Exercise - Add the Linkerd data plane proxies to our todo application
First of all, let’s drop the todobackend-v1 Deployment and the corresponding Service and also the various sampleapp parts that were used for demo purposes during the Ingress exercises. They won’t be needed anymore, so:
kubectl delete deployment,service todobackend-v1
kubectl delete deployment,service,ingress sampleapp
kubectl delete deployment,service sampleapp-subpath
kubectl delete ingress sampleapp-traefik
Milestone: K8S/SERVICEMESHES/CLEANUP
This adding can now be done by adjusting a deployment on-the-fly, as follows:
kubectl get deployments todoui -o yaml | linkerd inject - | kubectl apply -f -
Of course, if you do not wish to add them to all deployments individually, you could do it in bulk. I.e. execute the following to add the data plane proxies to all deployments:
kubectl get deployments -o yaml | linkerd inject - | kubectl apply -f -
Yes, this is safe to apply, even to our postgresdb, as that one has been protected by setting the deployment strategy to Recreate, i.e. disallowing a rolling update which could lead to concurrent Pod access to its PVC.
And if you know that all future Deployments in a Namespace should always receive the Linkerd data plane proxies you can instead just annotate the namespace accordingly and skip the individual inject calls:
Info
This is not needed for our exercises, but for the sake of completeness it is mentioned here:
# kubectl annotate namespace <your_namespace> linkerd.io/inject=enabled
Check the Pod redeployment via kubectl get po, and after a while you will find that all corresponding Pods have
been recreated, e.g.:
NAME                           READY   STATUS    RESTARTS   AGE
postgresdb-687d8fdcf6-grh4j    3/3     Running   0          2m38s
todobackend-644dcdc7d8-6h5bh   2/2     Running   3          2m38s
todoui-6db65fbc4c-wmc5x        2/2     Running   0          2m52s
Note that each Pod now consists of at least two containers. Let’s inspect those a bit to take a look under the hood (remember, you can easily fill out these placeholders in the following command using TAB-completion):
kubectl describe pod todoui-<ReplicaSetId>-<PodId>
[...]
Init Containers:
  linkerd-init:
    [...]
Containers:
  linkerd-proxy:
    [...]
  todoui:
    [...]
[...]
and also
kubectl logs todoui-<ReplicaSetId>-<PodId> linkerd-init
time="2024-01-19T07:30:16Z" level=info msg="/sbin/iptables-save -t nat"
time="2024-01-19T07:30:16Z" level=info msg="# Generated by iptables-save v1.8.8 on Fri Jan 19 07:30:16 2024\n*nat\n:PREROUTING ACCEPT [0:0]\n:INPUT ACCEPT [0:0]\n:OUTPUT ACCEPT [0:0]\n:POSTROUTING ACCEPT [0:0]\nCOMMIT\n# Completed on Fri Jan 19 07:30:16 2024\n"
time="2024-01-19T07:30:16Z" level=info msg="/sbin/iptables -t nat -N PROXY_INIT_REDIRECT -m comment --comment proxy-init/redirect-common-chain/1705649416"
[...]
time="2024-01-19T07:30:16Z" level=info msg="/sbin/iptables -t nat -A PREROUTING -j PROXY_INIT_REDIRECT -m comment --comment proxy-init/install-proxy-init-prerouting/1705649416"
time="2024-01-19T07:30:16Z" level=info msg="/sbin/iptables -t nat -N PROXY_INIT_OUTPUT -m comment --comment proxy-init/redirect-common-chain/1705649416"
[...]
time="2024-01-19T07:30:16Z" level=info msg="/sbin/iptables -t nat -A OUTPUT -j PROXY_INIT_OUTPUT -m comment --comment proxy-init/install-proxy-init-output/1705649416"
[...]
as well as
kubectl logs todoui-<ReplicaSetId>-<PodId> linkerd-proxy
[     0.002816s]  INFO ThreadId(01) linkerd2_proxy::rt: Using single-threaded proxy runtime
[     0.004728s]  INFO ThreadId(01) linkerd2_proxy: Admin interface on 0.0.0.0:4191
[     0.004752s]  INFO ThreadId(01) linkerd2_proxy: Inbound interface on 0.0.0.0:4143
[     0.004754s]  INFO ThreadId(01) linkerd2_proxy: Outbound interface on 127.0.0.1:4140
[     0.004760s]  INFO ThreadId(01) linkerd2_proxy: Tap interface on 0.0.0.0:4190
[     0.004762s]  INFO ThreadId(01) linkerd2_proxy: Local identity is default.default.serviceaccount.identity.linkerd.cluster.local
[     0.004770s]  INFO ThreadId(01) linkerd2_proxy: Identity verified via linkerd-identity-headless.linkerd.svc.cluster.local:8080 (linkerd-identity.linkerd.serviceaccount.identity.linkerd.cluster.local)
[     0.004784s]  INFO ThreadId(01) linkerd2_proxy: Destinations resolved via linkerd-dst-headless.linkerd.svc.cluster.local:8086 (linkerd-destination.linkerd.serviceaccount.identity.linkerd.cluster.local)
[     0.016973s]  INFO ThreadId(02) daemon:identity: linkerd_app: Certified identity id=default.default.serviceaccount.identity.linkerd.cluster.local
[...]
So, not only did the Pod receive an additional container in which the linkerd-proxy runs, but there was also an init container executed before any other containers were started that merely took care of redirecting all traffic to the linkerd-proxy container. Neat.
Generally, you can check whether the proxies in your personal Namespace are running as they should via
linkerd check --proxy.
Now our todo application can still be accessed just like before (remember to have your namespace exported into a
variable, e.g. export NAMESPACE=$(kubectl config view --minify --output 'jsonpath={..namespace}'); echo $NAMESPACE):
- via LoadBalancer Service
export LOADBALANCER_IP=$(kubectl get svc todoui -o jsonpath="{.status.loadBalancer.ingress[0].ip}"); echo $LOADBALANCER_IPcurl --silent http://$LOADBALANCER_IP:8090 | head -n 4
- via Nginx Ingress
(if you have finished the corresponding exercises)
export INGRESS_IP_NGINX=$(kubectl get ingress todo-nginx -o jsonpath='{.status.loadBalancer.ingress[].ip}'); echo $INGRESS_IP_NGINXcurl --silent --location --insecure http://todo.$NAMESPACE.$INGRESS_IP_NGINX.nip.io/ | head -n 4
- via Traefik Ingress
(if you have finished the corresponding exercises)
export INGRESS_IP_TRAEFIK=$(kubectl get ingress todo-traefik -o jsonpath='{.status.loadBalancer.ingress[].ip}'); echo $INGRESS_IP_TRAEFIKcurl --silent --location --insecure http://todo.$NAMESPACE.$INGRESS_IP_TRAEFIK.nip.io/ | head -n 4
These variables will not persist over a logout nor will they spread to other separate sessions, so remember to set them again whenever you (re)connect to your user VM.
A refresher: why do we need the --location --insecure with Ingress?
Of course, this comes at a price per Pod for the data plane proxy, check e.g.
kubectl top pod todoui-<ReplicaSetId>-<PodId> --containers
POD                       NAME            CPU(cores)   MEMORY(bytes)
todoui-6db65fbc4c-wmc5x   linkerd-proxy   6m           41Mi
todoui-6db65fbc4c-wmc5x   todoui          19m          467Mi
41Mi RAM and some CPU cycles already, but there is also the control plane as well as the various helper applications:
kubectl top pod --namespace linkerd; kubectl top pod --namespace linkerd-viz
NAME                                      CPU(cores)   MEMORY(bytes)
linkerd-destination-5b4854b65-dgr8k       8m           52Mi
linkerd-identity-68f57f5b6c-zwlwh         4m           36Mi
linkerd-proxy-injector-6868cc487f-sx7hx   2m           58Mi
NAME                           CPU(cores)   MEMORY(bytes)
metrics-api-9d86bf5f7-lj29t    3m           73Mi
prometheus-5b49dcd6bf-9mwhw    41m          164Mi
tap-5f48d6fcf9-j9qrs           3m           60Mi
tap-injector-5f6ccc889-99gwf   3m           41Mi
web-74c6bbd948-6bc9h           2m           42Mi
Exercise - Investigate network traffic metrics
Tip
If you just want to investigate Linkerd data using a web interface then please jump forward to the web interface exercise . Here we start accessing data using the raw CLI now. Please note that you will miss some adjustments then that we are about to apply to our setup, so you might want to revisit the following exercises later on.
Let’s put some load on our todo app via the Nginx Ingress. Of course, this requires that you have finished the corresponding exercises . If you haven’t you instead might want to continue with Traefik down below . Now execute in a separate window (and see above for the contents of the shell variables):
CURL="curl --silent --location --insecure"
TODO='NEW_TODO_Nginx'
while sleep 1; do
    $CURL https://todo.$NAMESPACE.$INGRESS_IP_NGINX.nip.io/      --data toDo=$TODO    # i.e. POST for creating an entry followed by GET for listing
    sleep 1
    $CURL https://todo.$NAMESPACE.$INGRESS_IP_NGINX.nip.io/$TODO --data value='Done!' # i.e. POST for deleting an entry followed by GET for listing
    date
done # > /dev/null
What does Linkerd know about this traffic now? For our deployments:
linkerd viz stat deployments
NAME          MESHED   SUCCESS      RPS   LATENCY_P50   LATENCY_P95   LATENCY_P99   TCP_CONN
postgresdb       1/1   100.00%   0.3rps           1ms           1ms           1ms         61
todobackend      3/3   100.00%   5.8rps           1ms           9ms          10ms         12
todoui           1/1   100.00%   1.9rps           9ms          19ms          20ms         11
So all our deployments are meshed (i.e. have the linkerd-proxies added to them), and we see the so-called golden metrics (per default for the past minute):
- success rate of requests (i.e. ratio of non-4XX and non-5XX requests)
- requests per second
- latency percentiles
There are various filtering options available, just check linkerd viz stat.
And now for specific Pods in our namespace, filtered by connections to a specific Service:
linkerd viz stat pods --to service/todobackend
NAME                       STATUS   MESHED   SUCCESS      RPS   LATENCY_P50   LATENCY_P95   LATENCY_P99   TCP_CONN
todoui-6db65fbc4c-wmc5x   Running      1/1   100.00%   1.9rps           2ms           4ms           5ms          0
Exercise - Investigate requests
But what is actually going on in our namespace?
linkerd viz top deployments
(press q to quit)
(press a/LeftArrowKey to scroll left, d/RightArrowKey to scroll right)

Source                                     Destination                   Method      Path                    Count    Best   Worst    Last  Success Rate
10.244.0.1                                 todobackend-574c75755d-zrfsn  GET         /hello                    132   947µs     6ms     1ms       100.00%
10.244.2.1                                 todobackend-574c75755d-l46jn  GET         /hello                    132   983µs     9ms     1ms       100.00%
10.244.0.1                                 todobackend-574c75755d-rbss8  GET         /hello                    132     1ms     5ms     1ms       100.00%
ingress-nginx-controller-649679ccbf-hwwjm  todoui-759c9c944c-vc6gq       GET         /                         106     8ms    46ms    10ms       100.00%
todoui-759c9c944c-vc6gq                    todobackend-574c75755d-rbss8  GET         /todos/                    94     4ms    10ms     6ms       100.00%
todoui-759c9c944c-vc6gq                    todobackend-574c75755d-zrfsn  GET         /todos/                    60     5ms    35ms    35ms       100.00%
todoui-759c9c944c-vc6gq                    todobackend-574c75755d-l46jn  GET         /todos/                    58     5ms     8ms     6ms       100.00%
ingress-nginx-controller-649679ccbf-hwwjm  todoui-759c9c944c-vc6gq       POST        /                          53    11ms    50ms    12ms       100.00%
ingress-nginx-controller-649679ccbf-hwwjm  todoui-759c9c944c-vc6gq       POST        /NEW_TODO_Nginx            53     9ms    28ms    10ms       100.00%
todoui-759c9c944c-vc6gq                    todobackend-574c75755d-rbss8  POST        /todos/NEW_TODO_Nginx      50     6ms    19ms     8ms       100.00%
todoui-759c9c944c-vc6gq                    todobackend-574c75755d-l46jn  DELETE      /todos/NEW_TODO_Nginx      50     6ms    15ms     8ms       100.00%
todoui-759c9c944c-vc6gq                    todobackend-574c75755d-rbss8  DELETE      /todos/NEW_TODO_Nginx      32     6ms    15ms     9ms       100.00%
todoui-759c9c944c-vc6gq                    todobackend-574c75755d-l46jn  POST        /todos/NEW_TODO_Nginx      32     7ms    12ms     8ms       100.00%
todoui-759c9c944c-vc6gq                    todobackend-574c75755d-zrfsn  POST        /todos/NEW_TODO_Nginx      24     6ms    25ms     8ms       100.00%
todoui-759c9c944c-vc6gq                    todobackend-574c75755d-zrfsn  DELETE      /todos/NEW_TODO_Nginx      24     6ms    26ms     8ms       100.00%
10.244.2.1                                 todobackend-574c75755d-l46jn  GET         /todos/                    14     4ms     7ms     6ms       100.00%
10.244.0.1                                 todobackend-574c75755d-zrfsn  GET         /todos/                    13     5ms    10ms     5ms       100.00%
10.244.0.1                                 todobackend-574c75755d-rbss8  GET         /todos/                    13     5ms    12ms     5ms       100.00%
Here we also see traffic coming in via our Nginx Ingress as that one is meshed as well. But we are not seeing any
traffic for postgresdb as that one utilizes a TCP connection. BTW, there are several filtering options available, cf.
linkerd viz top.
More details can be retrieved by tap‘ing into a deployment:
linkerd viz tap deployments/todoui
req id=6:0 proxy=in  src=10.244.0.23:46302 dst=10.244.0.30:8090 tls=true :method=POST :authority=todo.<your_namespace>.<your_Ingress_IP>.nip.io :path=/
req id=6:1 proxy=out src=10.244.0.30:43404 dst=10.244.0.34:8080 tls=true :method=POST :authority=todobackend:8080 :path=/todos/NEW_TODO_Nginx
rsp id=6:1 proxy=out src=10.244.0.30:43404 dst=10.244.0.34:8080 tls=true :status=200 latency=7420µs
end id=6:1 proxy=out src=10.244.0.30:43404 dst=10.244.0.34:8080 tls=true duration=51µs response-length=20B
rsp id=6:0 proxy=in  src=10.244.0.23:46302 dst=10.244.0.30:8090 tls=true :status=302 latency=10038µs
end id=6:0 proxy=in  src=10.244.0.23:46302 dst=10.244.0.30:8090 tls=true duration=12µs response-length=0B
req id=6:2 proxy=in  src=10.244.0.23:46302 dst=10.244.0.30:8090 tls=true :method=GET :authority=todo.<your_namespace>.<your_Ingress_IP>.nip.io :path=/
req id=6:3 proxy=out src=10.244.0.30:43404 dst=10.244.0.34:8080 tls=true :method=GET :authority=todobackend:8080 :path=/todos/
rsp id=6:3 proxy=out src=10.244.0.30:43404 dst=10.244.0.34:8080 tls=true :status=200 latency=3665µs
end id=6:3 proxy=out src=10.244.0.30:43404 dst=10.244.0.34:8080 tls=true duration=297µs response-length=34B
rsp id=6:2 proxy=in  src=10.244.0.23:46302 dst=10.244.0.30:8090 tls=true :status=200 latency=7085µs
end id=6:2 proxy=in  src=10.244.0.23:46302 dst=10.244.0.30:8090 tls=true duration=268µs response-length=2245B
<!-- this line inserted for clarity -->
req id=6:4 proxy=in  src=10.244.0.23:46302 dst=10.244.0.30:8090 tls=true :method=POST :authority=todo.<your_namespace>.<your_Ingress_IP>.nip.io :path=/NEW_TODO_Nginx
req id=6:5 proxy=out src=10.244.0.30:43404 dst=10.244.0.34:8080 tls=true :method=DELETE :authority=todobackend:8080 :path=/todos/NEW_TODO_Nginx
rsp id=6:5 proxy=out src=10.244.0.30:43404 dst=10.244.0.34:8080 tls=true :status=200 latency=16643µs
end id=6:5 proxy=out src=10.244.0.30:43404 dst=10.244.0.34:8080 tls=true duration=97µs response-length=22B
rsp id=6:4 proxy=in  src=10.244.0.23:46302 dst=10.244.0.30:8090 tls=true :status=302 latency=20326µs
end id=6:4 proxy=in  src=10.244.0.23:46302 dst=10.244.0.30:8090 tls=true duration=27µs response-length=0B
req id=6:6 proxy=in  src=10.244.0.23:46302 dst=10.244.0.30:8090 tls=true :method=GET :authority=todo.<your_namespace>.<your_Ingress_IP>.nip.io :path=/
req id=6:7 proxy=out src=10.244.0.30:43418 dst=10.244.0.34:8080 tls=true :method=GET :authority=todobackend:8080 :path=/todos/
rsp id=6:7 proxy=out src=10.244.0.30:43418 dst=10.244.0.34:8080 tls=true :status=200 latency=21039µs
end id=6:7 proxy=out src=10.244.0.30:43418 dst=10.244.0.34:8080 tls=true duration=1911µs response-length=17B
rsp id=6:6 proxy=in  src=10.244.0.23:46302 dst=10.244.0.30:8090 tls=true :status=200 latency=39580µs
end id=6:6 proxy=in  src=10.244.0.23:46302 dst=10.244.0.30:8090 tls=true duration=1051µs response-length=1945B
^C
So we see the POST request for creating an entry coming in from our Nginx Ingress controller (10.244.0.23) reaching the todoui Pod (10.244.0.30), which in turn then sends a corresponding request to the todobackend Pod (10.244.0.34). Once that one has ended the todoui Pod responds with a HTTP 302 to Nginx Ingress which triggers a GET.
And then follows the POST request for deleting the entry, which in turn causes a DELETE to the todobackend, also eventually responding with a HTTP 302 which triggers another GET.
And in addition to the various methods, paths and metrics Linkerd also indicates that all connections are encrypted using mutual TLS (mTLS), i.e. with both sender and receiver using certificates to identify each other and to encrypt the communication - as handled by the sidecar proxies.
By the way, Linkerd readily reports the same when asked suitably:
linkerd viz edges deployments
SRC                        DST           SRC_NS               DST_NS             SECURED
ingress-nginx-controller   todoui        ingress-nginx        <your_namespace>   √
prometheus                 postgresdb    linkerd-viz          <your_namespace>   √
prometheus                 todobackend   linkerd-viz          <your_namespace>   √
prometheus                 todoui        linkerd-viz          <your_namespace>   √
tap                        todoui        linkerd-viz          <your_namespace>   √
todobackend                postgresdb    <your_namespace>     <your_namespace>   √
todoui                     todobackend   <your_namespace>     <your_namespace>   √
In addition to those connections we had already observed above, also the connections from Linkerd’s Prometheus monitoring instance and from the tap interface which gathered the data from above are secured.
Still, this illustrates an important limitation: Linkerd only utilizes opportunistic mTLS. I.e. it tries to establish secured communication, but does not enforce it and will still allow unencrypted traffic. For instance, it is still possible to connect to our todo application using the LoadBalancer Service.
And while talking about limitations: the trust anchor generated by linkerd install ... expires after 365 days and must
be manually rotated, cf. Automatic mTLS | Linkerd
.
Exercise - Investigate traffic when using Traefik
Let’s put some load on our todo app via the Traefik Ingress. Of course, this requires that you have finished the corresponding exercises . If you haven’t you instead might want to continue with Nginx up above . Then execute in a separate window (and see above for the contents of the shell variables):
CURL="curl --silent --location --insecure"
TODO='NEW_TODO_Traefik'
while sleep 1; do
    $CURL https://todo.$NAMESPACE.$INGRESS_IP_TRAEFIK.nip.io/      --data toDo=$TODO    # i.e. POST for creating an entry followed by GET for listing
    sleep 1
    $CURL https://todo.$NAMESPACE.$INGRESS_IP_TRAEFIK.nip.io/$TODO --data value='Done!' # i.e. POST for deleting an entry followed by GET for listing
    date
done # > /dev/null
and check via
linkerd viz top deployments
linkerd viz tap deployments/todoui
The former will show the requests, and the latter will indicate that mTLS is already fully in place.
And with
linkerd viz edges deployments
we can see we are on par with Nginx Ingress again.
Exercise - Observe traffic on the network level and confirm encryption
Let’s go one step further in injecting our todoui Deployment:
kubectl get deployments todoui -o yaml | linkerd inject --enable-debug-sidecar - | kubectl apply -f -
Once the new Pod is running (check via kubectl get pods --watch), you’ll see it now consists of three containers (plus
one init container):
kubectl describe pod todoui-<ReplicaSetId>-<PodId>
[...]
Init Containers:
  linkerd-init:
    [...]
Containers:
  linkerd-proxy:
    [...]
  todoui:
    [...]
  linkerd-debug:
    [...]
[...]
And the linkerd-debug container offers various tools for debugging, e.g.
kubectl exec -it deployment/todoui --container linkerd-debug -- tshark -i any -f tcp -Y http.request # -V
Running as user "root" and group "root". This could be dangerous.
Capturing on 'any'
    2 0.000320335    127.0.0.1 ? 127.0.0.1    HTTP 495 POST / HTTP/1.1  (application/x-www-form-urlencoded)
    3 0.002899568  10.244.0.36 ? 127.0.0.1    HTTP 314 POST /todos/NEW_TODO_Nginx HTTP/1.1
   12 0.011261972    127.0.0.1 ? 127.0.0.1    HTTP 406 GET / HTTP/1.1
   13 0.012000220  10.244.0.36 ? 127.0.0.1    HTTP 214 GET /todos/ HTTP/1.1
   27 0.025452583    127.0.0.1 ? 127.0.0.1    HTTP 501 POST /NEW_TODO_Nginx HTTP/1.1  (application/x-www-form-urlencoded)
   28 0.026236621  10.244.0.36 ? 127.0.0.1    HTTP 247 DELETE /todos/NEW_TODO_Nginx HTTP/1.1
   35 0.033671046    127.0.0.1 ? 127.0.0.1    HTTP 406 GET / HTTP/1.1
   39 0.034546515  10.244.0.36 ? 127.0.0.1    HTTP 214 GET /todos/ HTTP/1.1
^C8 packets captured
(Stop capturing packets by pressing Ctrl+C.)
As you can see there is no unencrypted traffic sent to anything but 127.0.0.1, i.e. localhost (except maybe for some internal checks triggered by livenessProbe or readinessProbe). By the way, per default the linkerd-debug container already logs all traffic, i.e. including the encrypted parts just showing up as TCP connections, cf.
kubectl logs todoui-<ReplicaSetId>-<PodId> linkerd-debug --follow.
Still, better use those linkerd-debug containers sparingly as they can quickly consume quite some resources, cf.
kubectl top pod todoui-<ReplicaSetId>-<PodId> --containers
POD                       NAME            CPU(cores)   MEMORY(bytes)
todoui-6454f6767d-8tn6c   linkerd-debug   4m           675Mi
todoui-6454f6767d-8tn6c   linkerd-proxy   13m          36Mi
todoui-6454f6767d-8tn6c   todoui          15m          487Mi
So just kubectl edit deployment todoui and remove the corresponding config.linkerd.io/enable-debug-sidecar: “true”
annotation once you are done with debugging.
Exercise - Create a ServiceProfile for todoui
Service profiles provide Linkerd additional information about a service and how to handle requests for a service. For instance, remember our /stress endpoint from Exercise - Autoscale the instances of the application ?
time curl --silent --location --insecure http://todo.$NAMESPACE.$INGRESS_IP_NGINX.nip.io/stress > /dev/null
(Of course, this requires that you have finished the corresponding Ingress Nginx exercises .)
real    0m6,567s
user    0m0,004s
sys     0m0,009s
So, we have a flaw in our application that allows external sources to cheaply trigger excessive resource consumption. While we willingly used this in the past to illustrate horizontal Pod autoscaling, it basically is a Denial-of-Service (DoS) vulnerability.
Let’s put Linkerd to use now to offset this vulnerability somewhat. First, create todoui-profile.yaml as follows (yes,
execute it all at once):
cat <<.EOF > todoui-profile.yaml
apiVersion: linkerd.io/v1alpha2
kind: ServiceProfile
metadata:
  name: todoui.$NAMESPACE.svc.cluster.local
spec:
  routes:
    - condition:
        method: GET
        pathRegex: /
      name: GET /
    - condition:
        method: GET
        pathRegex: /stress
      name: GET /stress
      timeout: 100ms
    - condition:
        method: POST
        pathRegex: /
      name: POST /
    - condition:
        method: POST
        pathRegex: /[^/]+
      name: POST /{id}
.EOF
This file contains how our todoui component is normally called, allowing us to summarize similar requests which would
otherwise pollute our output with unnecessary detail. And it allows us to apply further measures to certain conditions /
routes, just like the timeout: 100ms added to the /stress endpoint.
However, we also need to teach our Ingress resources to play nicely together with Linkerd as follows.
First by adding the required annotation to our Nginx Ingress:
nano todoapp-ingress.yaml
and make the todo-nginx annotations look like this (and just ignore those for todo-nginx-backend-basic-auth):
annotations:
  nginx.ingress.kubernetes.io/service-upstream: "true"
(i.e. add these two lines at the correct spot)
This teaches Nginx to set headers that Linkerd can analyze for identifying where a request will be routed, allowing it to apply its own traffic shaping rules.
Now apply these files and retry stressing the todoui:
kubectl apply -f todoui-profile.yaml; kubectl apply -f todoapp-ingress.yaml
time curl --silent --location --insecure http://todo.$NAMESPACE.$INGRESS_IP_NGINX.nip.io/stress
real    0m0,131s
user    0m0,010s
sys     0m0,006s
OK, that seems better. And we can check the now defined routes as follows (you might need to wait a bit for linkerd to collect sufficient data for display):
linkerd viz routes deployments/todoui
ROUTE         SERVICE   SUCCESS      RPS   LATENCY_P50   LATENCY_P95   LATENCY_P99
GET /          todoui   100.00%   0.8rps           7ms          37ms          40ms
GET /stress    todoui         -        -             -             -             -
POST /         todoui   100.00%   0.4rps          15ms          87ms          98ms
POST /{id}     todoui   100.00%   0.4rps           9ms          87ms          98ms
[DEFAULT]      todoui         -        -             -             -             -
With this ServiceProfile applied linkerd viz routes summarizes similar requests now, with [DEFAULT] being the
default route for those requests for which no routes matched.
Please note that our call to /stress yielded no output, and it won’t be counted in the above listing, as that request was intercepted by Linkerd due to the timeout rule. Of course Linkerd cannot speed up this specific request, but it can intercept it. How the application business logic copes with such an intercepted request is an entirely different matter, though.
And, in all honesty, in this particular case with a specifically designed /stress endpoint, intercepting the request actually makes the situation much worse. For the todoui will still execute the request thus still consuming resources, it is just that it doesn’t have any connection to yield the output to anymore, freeing the requester to start another call to /stress much earlier. Nonetheless, it serves to illustrate the general principle here.
Please note that similar request filtering could be done directly at the Ingress controller, of course. However, using a Service Mesh this can be done at any level within our cluster and not just during Ingress.
Traefik
You might have already noticed that no such request filtering is yet taking place when accessing our todo app via Traefik. Of course, this requires that you have finished the corresponding exercises .
time curl --silent --location --insecure http://todo.$NAMESPACE.$INGRESS_IP_TRAEFIK.nip.io/stress
To make Traefik play nicely together with Linkerd we need to add the required annotation to our Traefik Ingress as well, in a suitable format:
nano todoapp-ingress-traefik.yaml
and add the following to the todo-traefik annotations (and just ignore those for todo-traefik-redirect and
todo-traefik-backend-basic-auth):
traefik.ingress.kubernetes.io/router.middlewares: <your_namespace>-l5d-header-todo-app-traefik@kubernetescrdAlso append the following Middleware to the very same file:
---
apiVersion: traefik.io/v1alpha1
kind: Middleware
metadata:
  name: l5d-header-todo-app-traefik
spec:
  headers:
    customRequestHeaders:
      l5d-dst-override: "todoui.<your_namespace>.svc.cluster.local:8090"
This teaches Traefik to set headers that Linkerd can analyze for identifying where a request will be routed, allowing it to apply its own traffic shaping rules.
Now apply this file and retry stressing the todoui:
kubectl apply -f todoapp-ingress-traefik.yaml
time curl --silent --location --insecure http://todo.$NAMESPACE.$INGRESS_IP_TRAEFIK.nip.io/stress
real    0m0,126s
user    0m0,004s
sys     0m0,008s
However, you might notice that not all request to the /stress endpoint will be filtered. This is due to internal peculiarities concerning how Traefik balances incoming requests into which we won’t dive any further here now.
Exercise - Access the Linkerd web interface
Again, we humans might prefer a different interface for accessing all these data on the fly. For that we can utilize the Linkerd web interface.
So let’s open a port-forwarding to this service:
kubectl port-forward --namespace linkerd-viz service/web 8084
Now you can follow the instructions for the port forwarding within your ssh client or Putty . Add a mapping from your local port 8084 to localhost:8084, and then you will be able to access this through your local browser at http://localhost:8084/ , using dual port-forwarding (first via ssh client, then via kubectl), and you should see the application like in the following pictures:
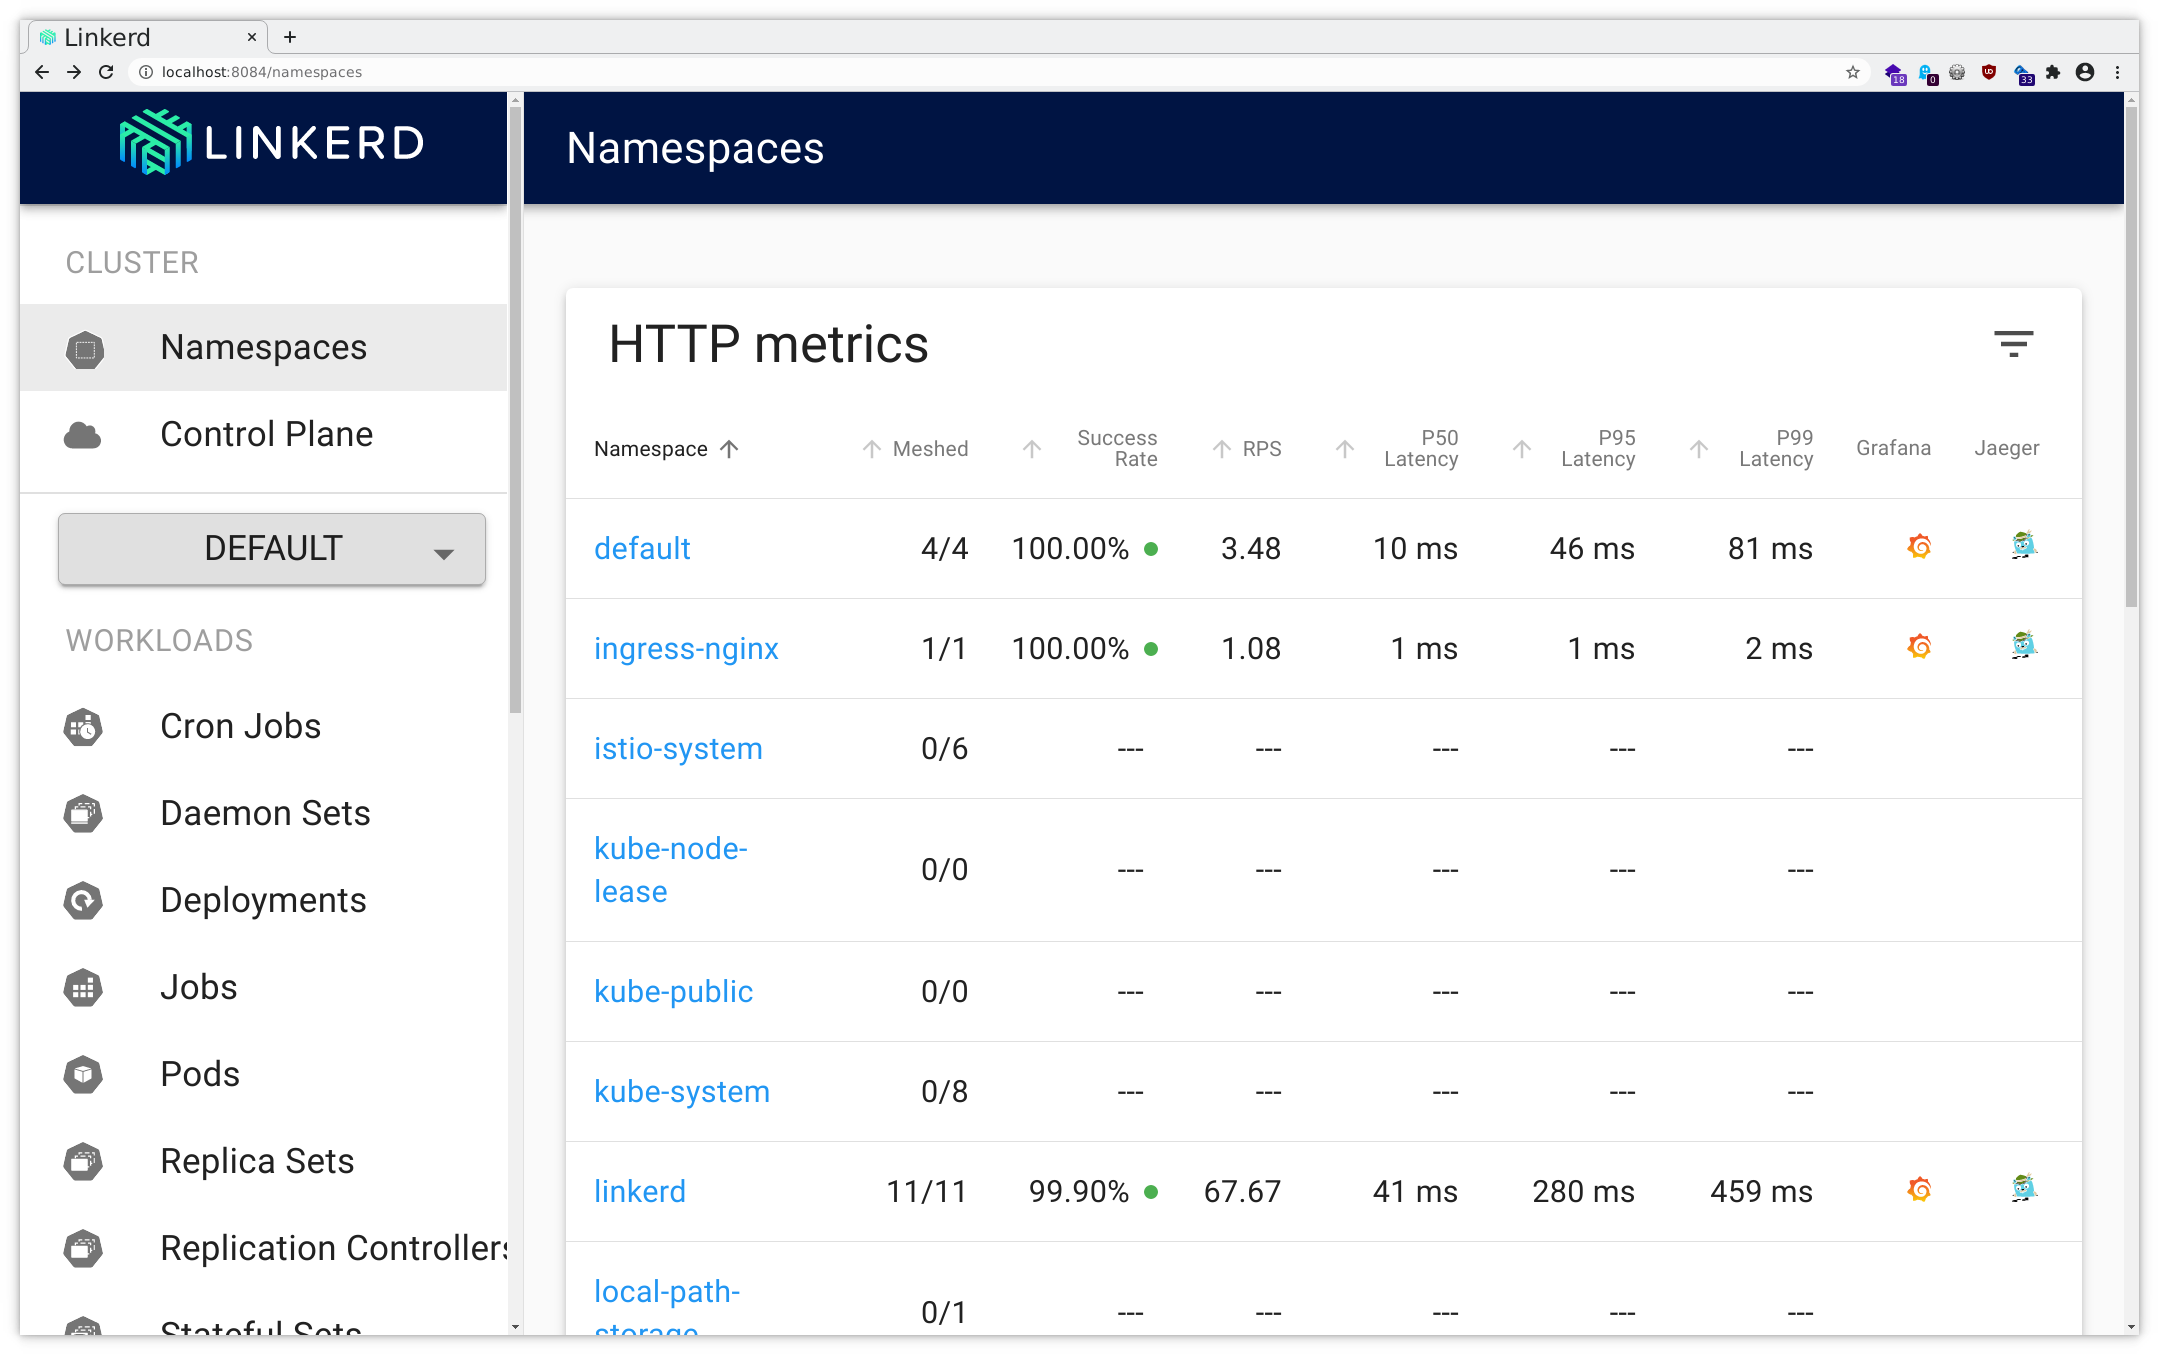
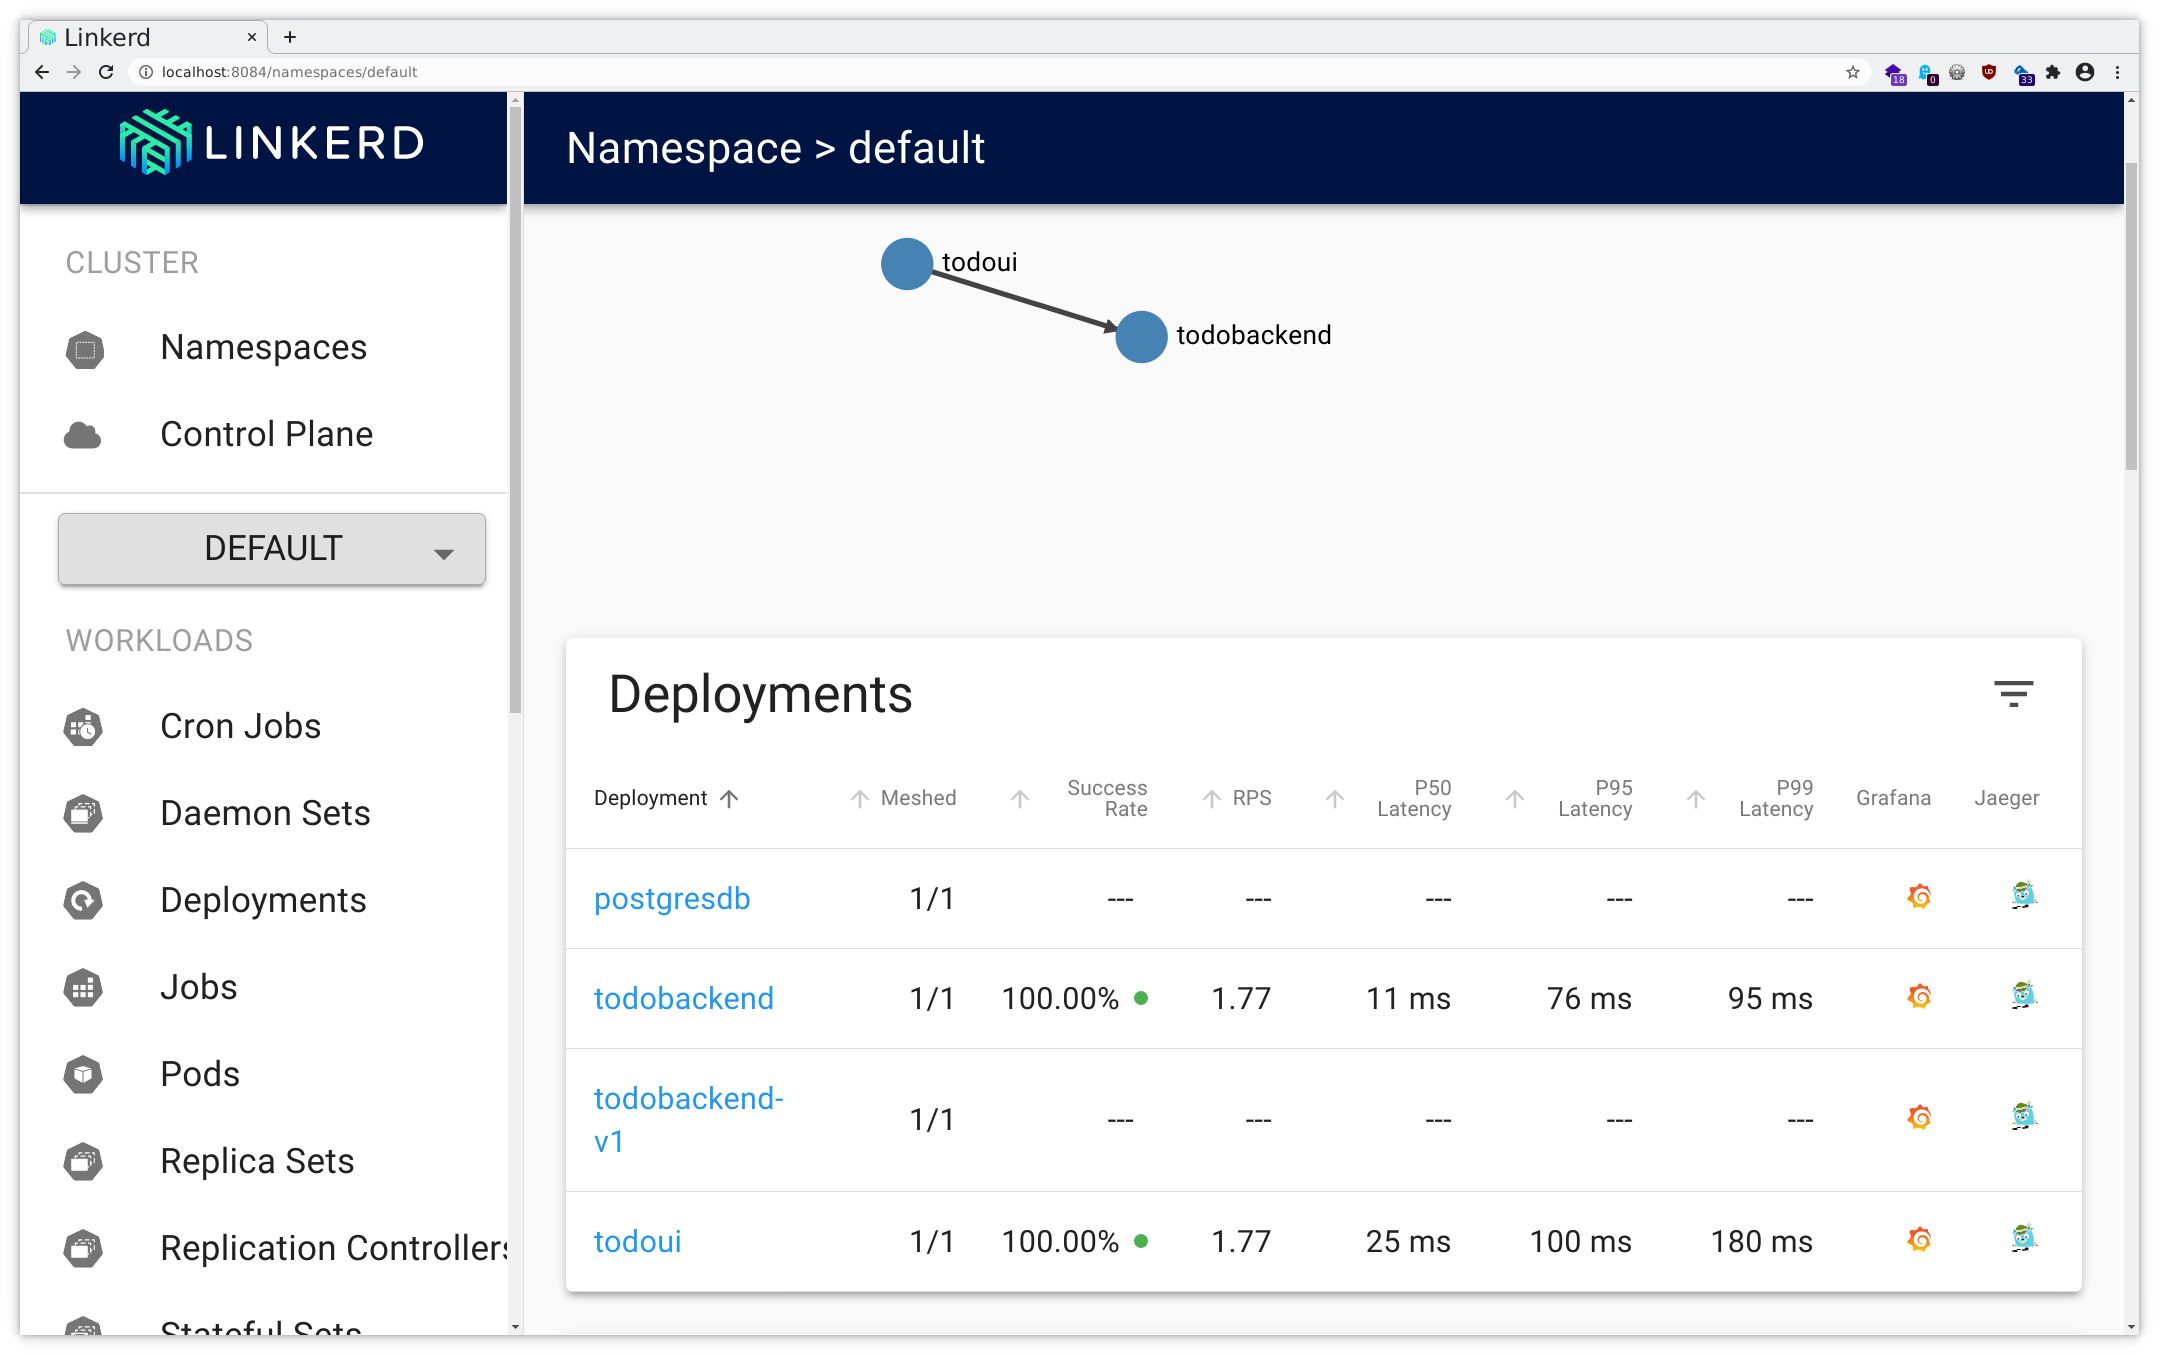
All you could query via CLI you will find here as well, and as you can see there also are links to Grafana (as provided by the Linkerd installation) offering lots of insight into various network metrics as well as various Linkerd metrics.
Feel free to browse through the UI a bit, investigating how the various metrics and other data are available for display.
Further outlook
Linkerd’s traffic split functionality allows you to dynamically shift arbitrary portions of traffic destined for a Kubernetes service to a different destination service. This feature can be used to implement sophisticated rollout strategies such as canary deployments and blue/green deployments, for example, by slowly easing traffic off of an older version of a service and onto a newer version.
Check Traffic Split for further details.
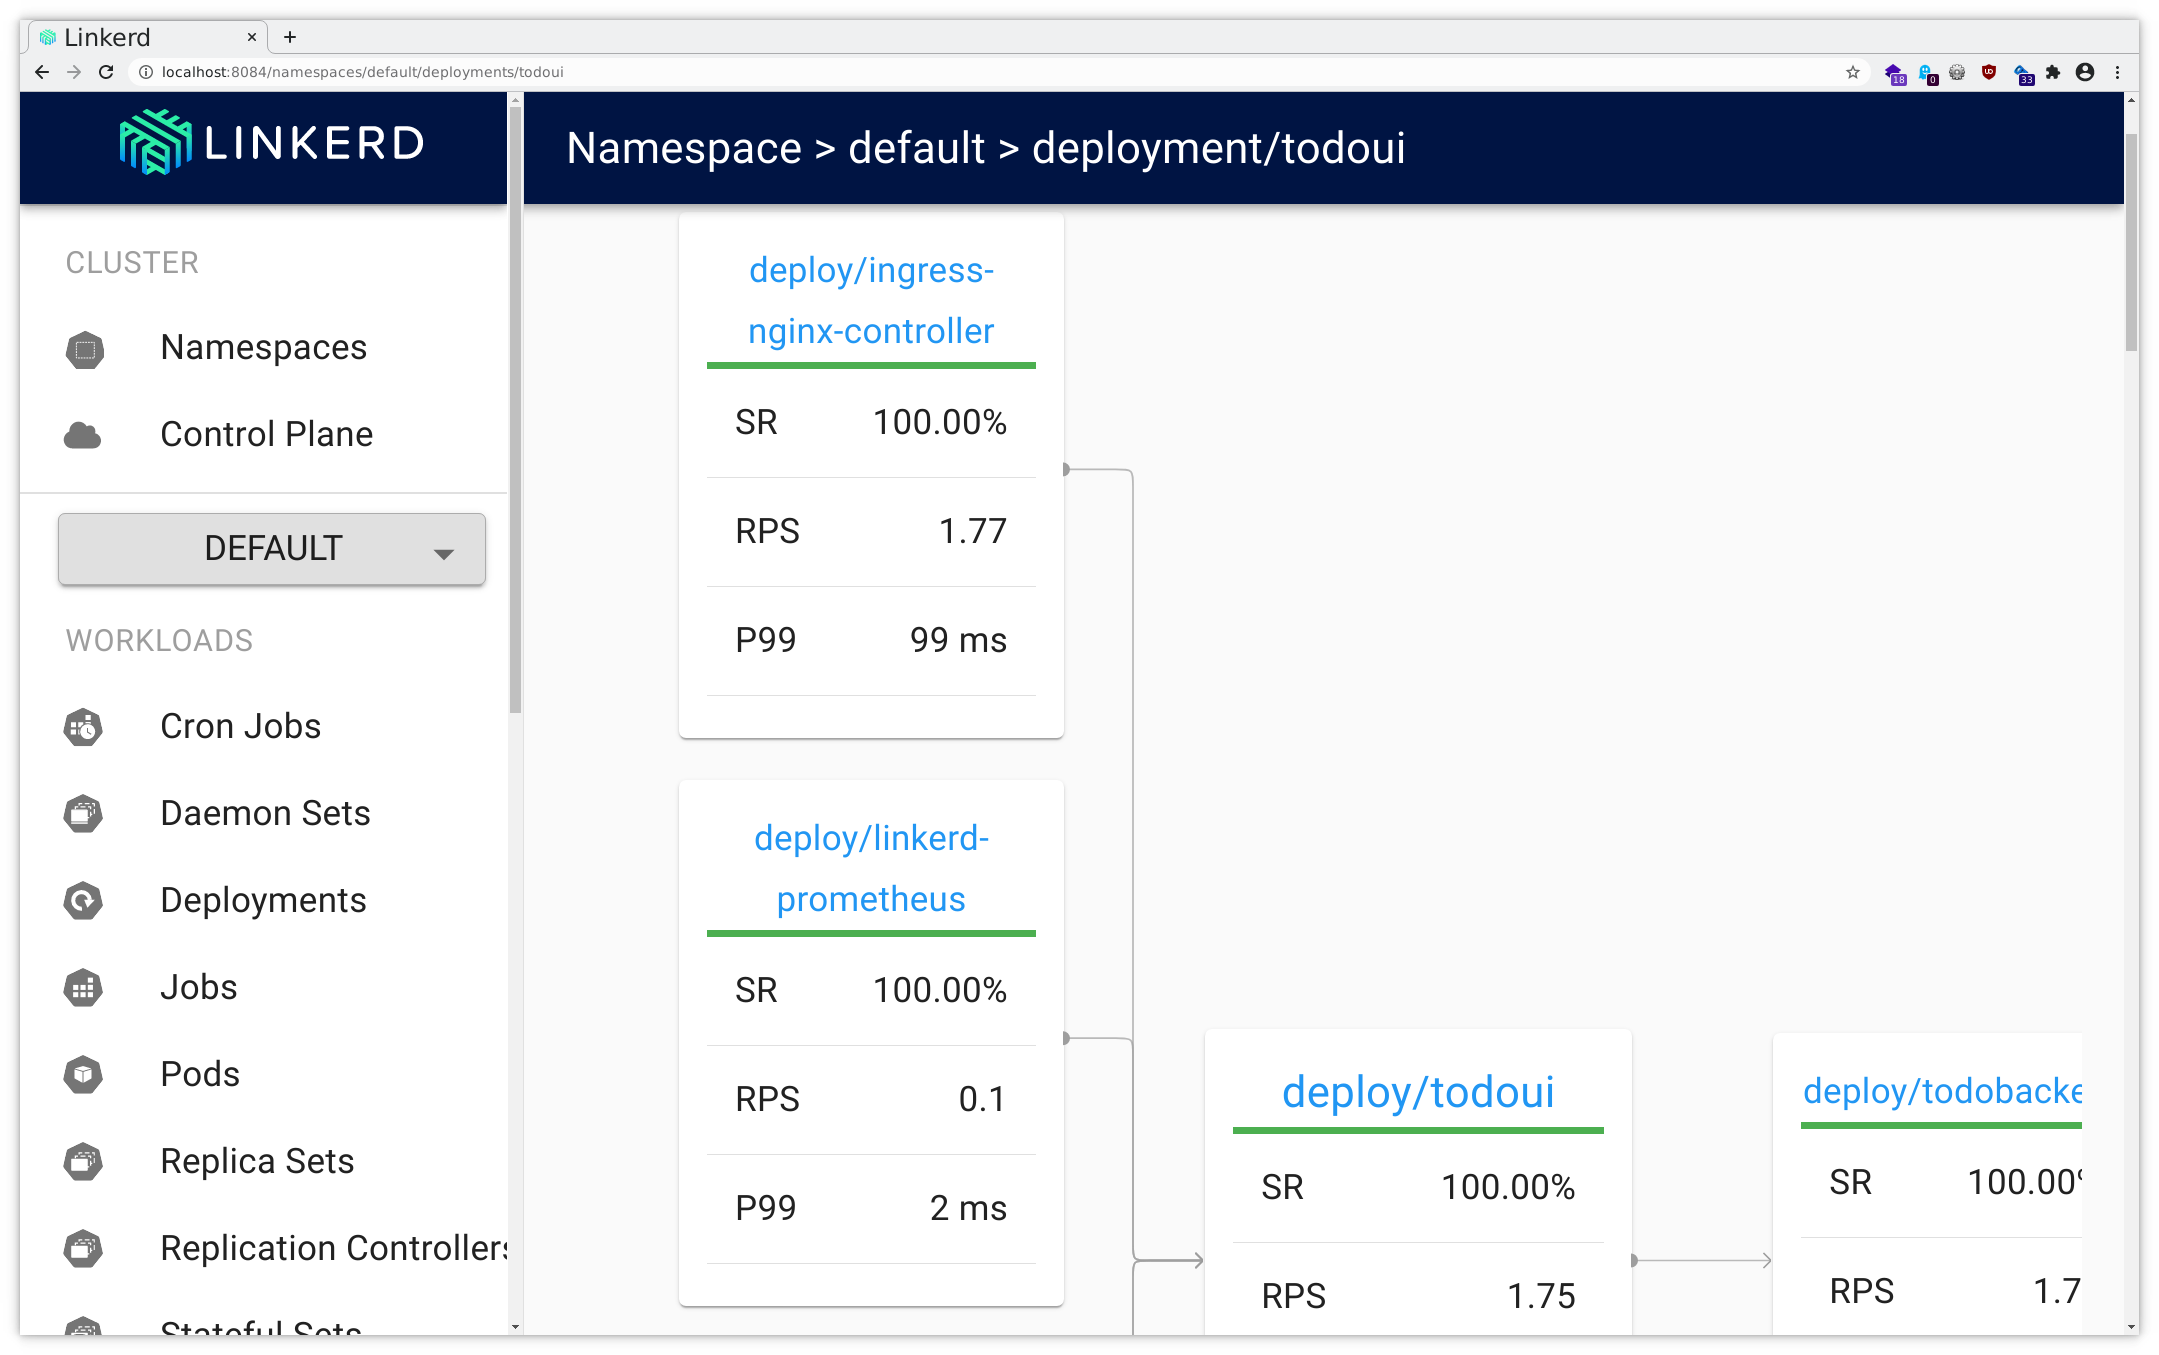
Linkerd can also be configured to emit trace spans from the proxies with will then be collected via Jaeger, allowing you to see exactly what time requests and responses spend inside. However, distributed tracing requires more changes and configuration. Still, out of the box Linkerd already provides
- live service topology and dependency graphs
- aggregated service health, latencies, and request volumes
- aggregated path / route health, latencies, and request volumes
as all can be seen in the screenshots above. Check Distributed tracing with Linkerd for further details.
Exercise - Remove the Linkerd data plane proxies from our todo application
If you want to investigate the next chapter about Istio , you need to remove the Linkerd data plane proxies before proceeding as Pods cannot be kept in two Service Meshes at the same time. For that now execute
kubectl patch deployments postgresdb todobackend todoui --type json \
    --patch='[{"op": "remove", "path": "/spec/template/metadata/annotations"}]'
which removes the corresponding Linkerd (well, actually, all) annotations from the deployments, causing new Pods to be created (and again this is safe for postgresdb due to the Recreate deployment strategy).
And - just for reference as this was not required for these exercises - if you have enabled automatic data plane proxy injection for your namespace you can undo this as follows:
kubectl annotate namespace <your_namespace> linkerd.io/inject-
However, we can keep Nginx Ingress and Traefik Ingress meshed with Linkerd, for Istio provides its own Ingress Controller.