Traces
If you are using Istio or Linkerd as a Service Mesh, these technologies automatically generate certain correlation headers when HTTP calls are routed through the Service Mesh data plane proxies. We already have investigated Istio’s standard tracing , whereas Linkerd’s tracing first requires specific configuration and thus had not been investigated so far.
Here we will cover traces independently of any Service Mesh, to showcase the possibilities. We will employ Jaeger for this, a CNCF graduated project that has already been set up in our cluster (yes, both Linkerd and Istio brought their own integrated Jaeger instance already, but let’s roll our own here to showcase handling from scratch). The CNCF refers to a generic OpenTracing incubating project working towards creating more standardized APIs and instrumentation for distributed tracing as well, and incidentally Jaeger is already compatible to OpenTracing, and of course several other contenders - Open Source or commercial - are available.
The OpenTracing project has been archived on January 31, 2022. Archiving OpenTracing has always been the intention of the project maintainers following the merger of OpenTracing and OpenCensus into OpenTelemetry . To migrate OpenTracing to OpenTelemetry, follow the documentation Migrating from OpenTracing .
Tip
Here we now start to delve deeper in the Ocelot-specific way of retrieving traces, using a custom Java agent for todoui/todobackend. For a more generic way of doing this you might want to skip this subchapter and continue with OpenTelemetry instead.
Jaeger, however, only provides the framework for collecting, storing and analyzing traces, whereas the parts of such a trace each must be generated and transmitted by a separate sampling agent on the client side. For that we will rely once more on Novatec’s inspectIT Ocelot that we had already used in the previous subchapter.
Exercise - Enable Ocelot to transmit traces
Info
Please note that this subchapter relies on changes applied in the previous Metrics subchapter, so make sure you have finished that one.
First of all let’s provide some rather specific inspectIT Ocelot configuration in order to get further insight into what our application is actually doing, without changing any application code, by activating the notoriously imprecise but still rather helpful auto-tracing within our application scope (yes, execute it all at once):
cat <<.EOF > ocelot-config.yaml
apiVersion: v1
kind: ConfigMap
metadata:
  name: ocelot-config
data:
  auto-tracing.yaml: |-
    inspectit:
      tracing:
        auto-tracing:
          frequency: 1ms # that has a huge performance impact in prod, but any higher and the precision suffers further!
      instrumentation:
        scopes:
          's_auto_tracing':
            type:
              name: '.*Todo.*Application'
              matcher-mode: 'MATCHES'
        rules:
          'r_auto_tracing':
            scopes:
              's_auto_tracing': true
            tracing:
              start-span: true
              auto-tracing: true
      logging:
        debug: true
.EOF
Apply this file via kubectl apply -f ocelot-config.yaml.
With inspectIT Ocelot enabling it to transmit traces is basically just a matter of adding yet another environment
variable specifying where the traces will be collected. Our Jaeger setup (see above) provides a suitable DNS name and a
port for receiving traces via the thrift protocol, so just configure the environment variable
INSPECTIT_EXPORTERS_TRACING_JAEGER_URL with the value http://jaeger-collector.logging.svc:14268/api/traces in both
todobackend.yaml and todoui-versioned-0-3.yaml.
However, let’s also configure the environment variable INSPECTIT_SERVICE_NAME to correctly name the service with the
dot-separated namespace as a suffix, in order to ease selecting your individual services in Jaeger.
And of course let’s add the above specific configuration into the mix by mapping it into our Pods via a volume and
telling Ocelot via yet another environment variable INSPECTIT_CONFIG_FILE_BASED_PATH to also heed these settings.
and apply the resulting files:
kubectl apply -f todobackend.yaml && kubectl apply -f todoui-versioned-0-3.yaml
This will recreate our Deployments, and once the Pods will be running again Ocelot will start transmitting traces.
Setting the value of INSPECTIT_SERVICE_NAME won’t have any effect on our Grafana dashboards as we had utilized in the
previous subchapter, for the ServiceMonitor’s selector ensures that still the same Service will be selected, and it is
this Service’s name (i.e. still “todobackend”) that Prometheus will use for storing the metrics, with the value of
INSPECTIT_SERVICE_NAME as used by Ocelot for exporting the data stored separately in a label called “exported_service”
if they ever differ. In the previous subchapter we hadn’t bothered with this variable as it simply wasn’t required there
yet.
Exercise - Access the Jaeger web interface
Access the Jaeger UI through your local browser.
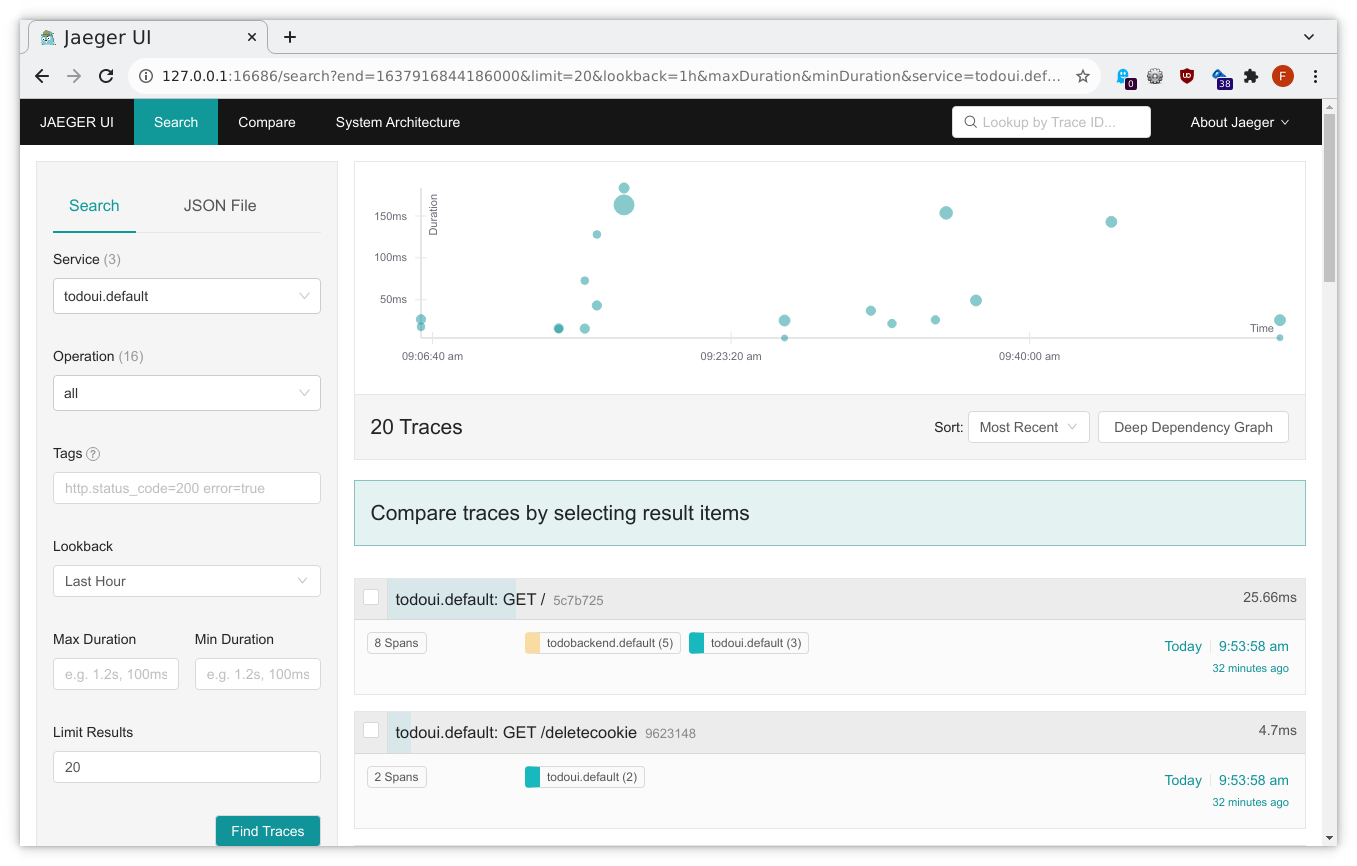
Select todoui.<your_namespace> in the Service dropdown in the upper left corner and then click on Find Traces all the way down in the down left corner and you will get an overview over the most recent traces related to your service, seeing some from your todoui service to your todobackend service:
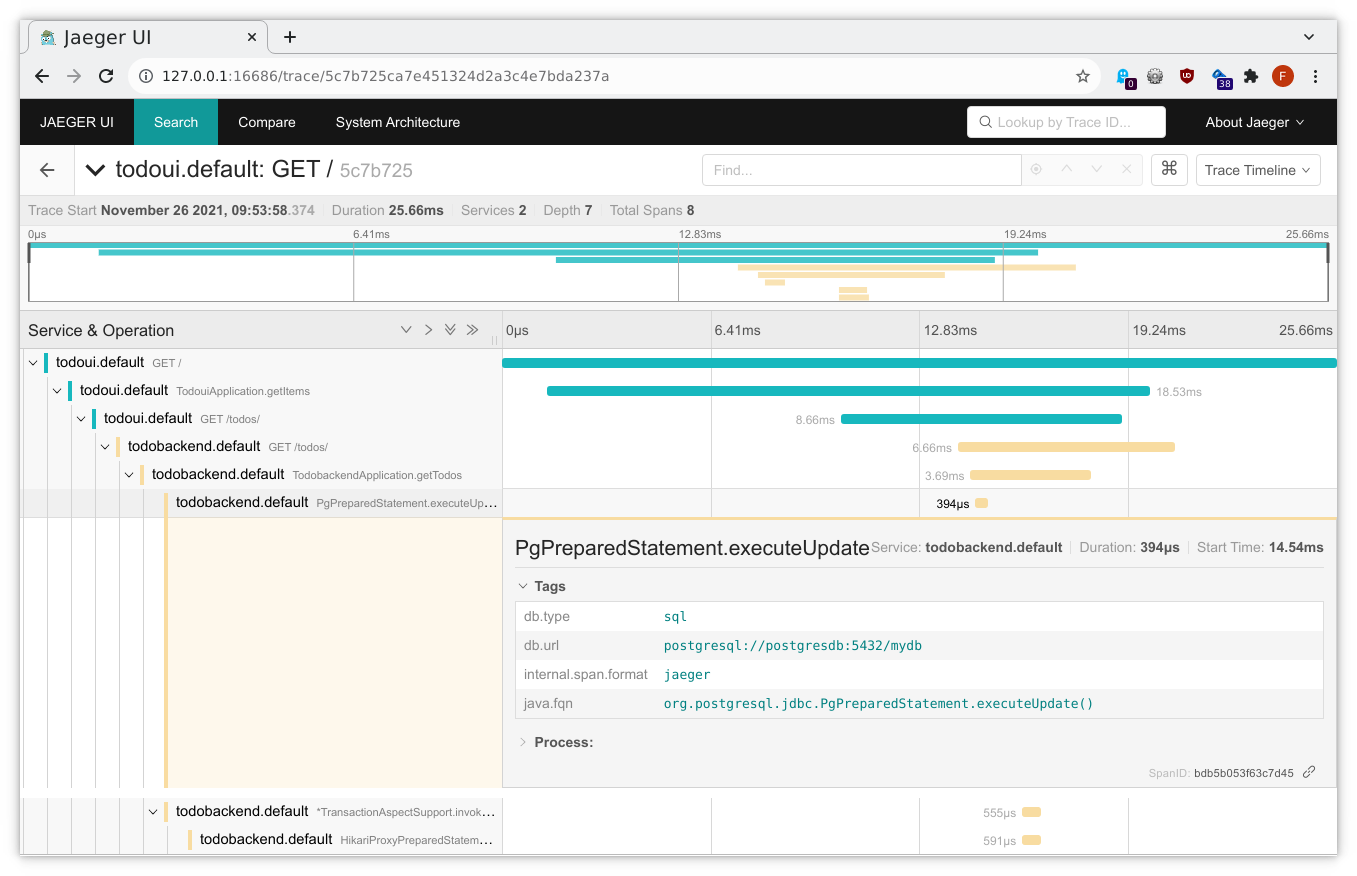
And clicking on a sample will yield something like the following, illustrating in which application component a specific request was handled for how long (any methods prefixed with an asterisk had been auto-traced by Ocelot):
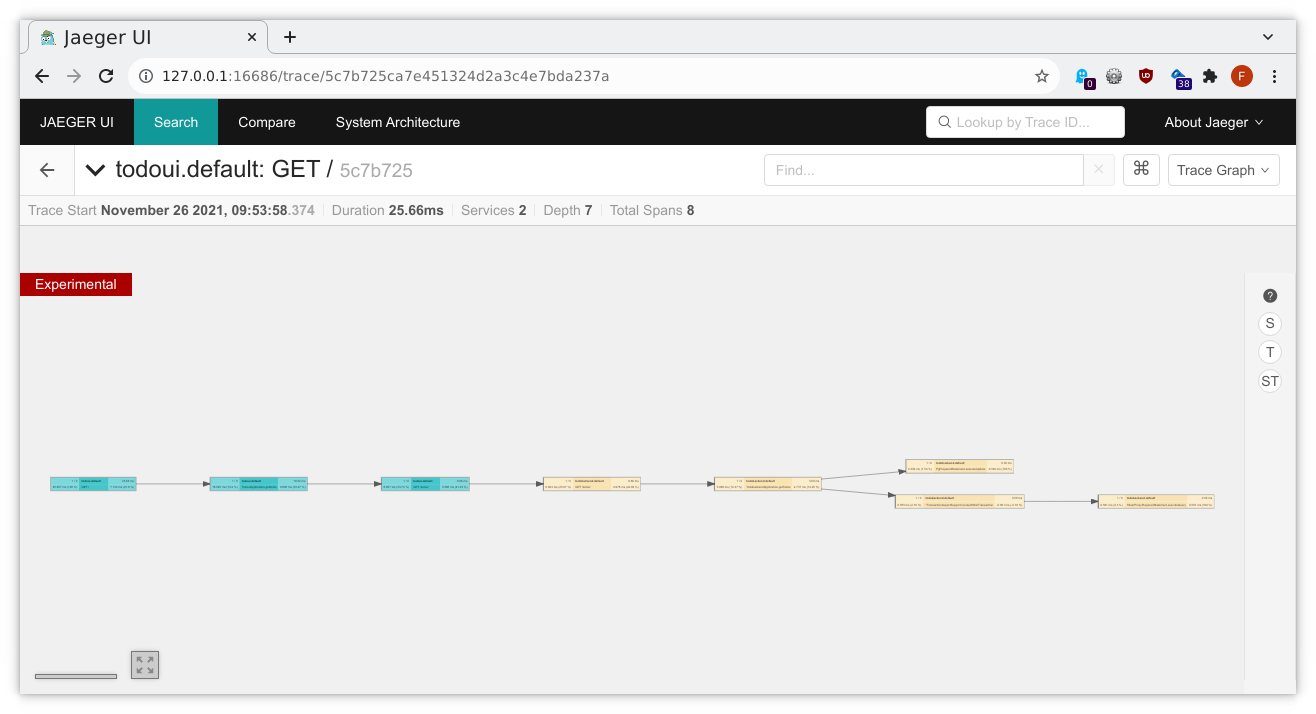
Changing from Trace Timeline to Trace Graph in the upper right corner will provide a different view:
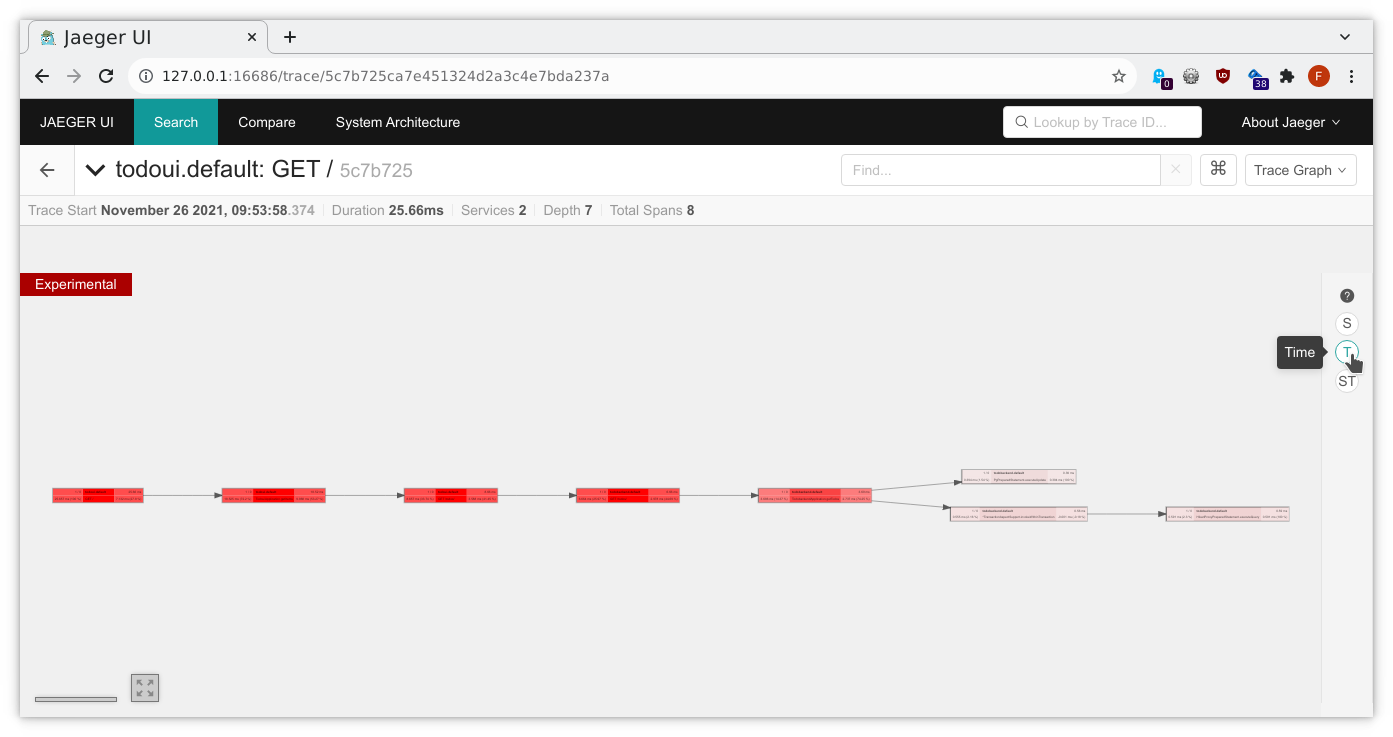
And here we can highlight in which spans our trace has spent the majority of its runtime by selecting Time mode on the right side:
Compared to Istio’s standard tracing which was solely gathered on the network level you will already notice that more details were available. Of course, even more detailed traces are possible, allowing us to pinpoint where exactly in our application stack something went wrong, if at all, but that will require adding further instrumentation, which is well beyond the scope of these exercises.