Istio
Istio is an open platform-independent service mesh that provides traffic management, policy enforcement, and telemetry collection:
- Open: Istio is being developed and maintained as open-source software using the Apache License 2.0 . The Istio project was started by teams from Google and IBM in partnership with the Envoy team from Lyft. It’s been developed fully in the open on GitHub .
- Platform-independent: Istio is not targeted at any specific deployment environment. Istio currently supports environments running container orchestration platforms such as Kubernetes and Nomad with Consul.
- Service mesh: Istio is designed to manage communications between microservices and applications. Without requiring changes to the underlying services, Istio provides automated baseline traffic resilience, service metrics collection, distributed tracing, traffic encryption, protocol upgrades, and advanced routing functionality for all service-to-service communication.
Istio also supports Traffic Access Control, Circuit Breaking and Rate Limiting, and more Chaos Monkey-style Testing (Failure Injection) and Distributed Tracing, and mTLS for all protocols and not just all except TCP as we had seen for Linkerd .
Istio has the most features and flexibility of any of the popular Service Meshes by far, but remember that flexibility means complexity, so your team needs to be ready for that.
By the way, “istio” is the Greek word for “sail”.
Although Google, IBM, and Lyft sponsored the original development of Istio, they do not offer any kind of support for it. However, IBM’s OpenShift Enterprise product offers paid support for OpenShift Service Mesh , a productized version of Istio designed for performance and operational stability.
An Ambient Mesh provides a new dataplane mode for Istio without sidecars and has reached General Availability in v1.24 .
Exercise - Add the Istio data plane proxies to our todo application
Please note that the corresponding Pods cannot be part of a different Service Mesh. Cf. the very end of the Linkerd chapter for reference.
First of all, if you haven’t already done let’s drop the todobackend-v1 Deployment and the corresponding Service and also the various sampleapp parts that were used for demo purposes during the Ingress exercises. They won’t be needed anymore, so:
kubectl delete deployment,service todobackend-v1
kubectl delete deployment,service,ingress sampleapp
kubectl delete deployment,service sampleapp-subpath
kubectl delete ingress sampleapp-traefik
Milestone: K8S/SERVICEMESHES/CLEANUP
This adding can be done by adjusting a deployment on-the-fly, e.g. as follows:
kubectl get deployments todoui -o yaml | istioctl kube-inject -f - | kubectl apply -f -
Of course, if you do not wish to add them to all deployments individually, you could do it in bulk. I.e. execute the following to add the data plane proxies to all deployments:
kubectl get deployments -o yaml | istioctl kube-inject -f - | kubectl apply -f -
Yes, this is safe to apply, even to our postgresdb, as that one has been protected by setting the deployment strategy to Recreate, i.e. disallowing a rolling update which could lead to concurrent Pod access to its PVC.
And if you know that all future Deployments in a Namespace should always receive the Istio data plane proxies you instead can just label the namespace accordingly. Let’s do this now as we are about to recreate some resources in the course of this chapter and thus can skip the future individual inject calls (in fact, then we even have to skip those, as otherwise Istio gets confused and cannot start the data plane proxy):
kubectl label namespace $NAMESPACE istio-injection=enabled
(Check the preceding Linkerd
subchapter if you don’t have that variable
$NAMESPACE defined anymore.)
Check the Pod redeployment via kubectl get po, and after a while you will find that all corresponding Pods have been
recreated, e.g.:
NAME                           READY   STATUS    RESTARTS   AGE
postgresdb-5b5695c7b5-xqn2v    3/3     Running   0          104s
todobackend-588d6475cf-bwrhw   2/2     Running   0          104s
todoui-55d56685db-h4rk2        2/2     Running   0          2m1s
Note that each Pod now consists of at least two containers. Let’s inspect those a bit to take a look under the hood (remember, you can easily fill out these placeholders in the following command using TAB-completion):
kubectl describe pod todoui-<ReplicaSetId>-<PodId>
[...]
Init Containers:
  istio-init:
    [...]
Containers:
  todoui:
    [...]
  istio-proxy:
    [...]
[...]
and also
kubectl logs todoui-<ReplicaSetId>-<PodId> istio-init
2024-02-29T13:50:38.218070Z     info    Istio iptables environment:
[...]
2024-02-29T13:50:38.218163Z     info    Running iptables-restore with the following input:
[...]
-A ISTIO_REDIRECT -p tcp -j REDIRECT --to-ports 15001
-A ISTIO_IN_REDIRECT -p tcp -j REDIRECT --to-ports 15006
[...]
COMMIT
# Completed on Thu Feb 29 13:50:38 2024
as well as
kubectl logs todoui-<ReplicaSetId>-<PodId> istio-proxy
[...]
2024-02-29T13:50:39.308541Z     info    Version 1.20.2-5f5d657c72d30a97cae97938de3a6831583e9f15-Clean
[...]
2024-02-29T13:50:39.322015Z     info    CA Endpoint istiod.istio-system.svc:15012, provider Citadel
2024-02-29T13:50:39.322422Z     info    Using CA istiod.istio-system.svc:15012 cert with certs: var/run/secrets/istio/root-cert.pem
[...]
2024-02-29T13:50:39.752761Z     info    cache   generated new workload certificate      latency=395.368919ms ttl=23h59m59.247247013s
[...]
2024-02-29T13:50:40.657539Z     info    Readiness succeeded in 1.362003732s
2024-02-29T13:50:40.657920Z     info    Envoy proxy is ready
So, not only did the Pod receive an additional container in which the istio-proxy runs, but there was also an init container executed before any other containers were started that merely took care of redirecting all traffic to the istio-proxy container. Neat.
Now our todo application can still be accessed more or less like before, e.g. via LoadBalancer Service, so just execute in a separate terminal:
LOADBALANCER_IP=$(kubectl get svc todoui -o jsonpath="{.status.loadBalancer.ingress[0].ip}"); echo $LOADBALANCER_IP
CURL="curl --silent"
TODO='NEW_TODO_LoadBalancer'
while sleep 1; do
    $CURL http://$LOADBALANCER_IP:8090/      --data toDo=$TODO    # i.e. POST for creating an entry followed by GET for listing
    sleep 1
    $CURL http://$LOADBALANCER_IP:8090/$TODO --data value='Done!' # i.e. POST for deleting an entry followed by GET for listing
    date
done # > /dev/null
(Well, in fact this sample loop hides the fact that Istio per default introduces redirects on POST that we don’t notice here as we use curl without –location.)
Of course, this comes at a price per Pod for the data plane proxy, check e.g.
kubectl top pod todoui-<ReplicaSetId>-<PodId> --containers
POD                       NAME            CPU(cores)   MEMORY(bytes)
todoui-55d56685db-h4rk2   istio-proxy     13m          128Mi
todoui-55d56685db-h4rk2   todoui          26m          457Mi
which does not really compare favorably to Linkerd’s values of 41Mi RAM and fewer CPU cycles from the previous chapter.
But there is also the control plane as well as the various helper applications:
kubectl top pod --namespace istio-system
NAME                                    CPU(cores)   MEMORY(bytes)
grafana-75b5cddb4d-xw9nb                5m           52Mi
istio-ingressgateway-658c5c4489-qqmnf   18m          123Mi
istiod-6f5fd7cb8f-mmqbz                 6m           126Mi
jaeger-5795c4cf99-6lgsv                 2m           223Mi
kiali-6c49c7d566-xb2kd                  5m           48Mi
prometheus-9d5676d95-2hkfw              35m          174Mi
Exercise - Access the Kiali web interface to Istio
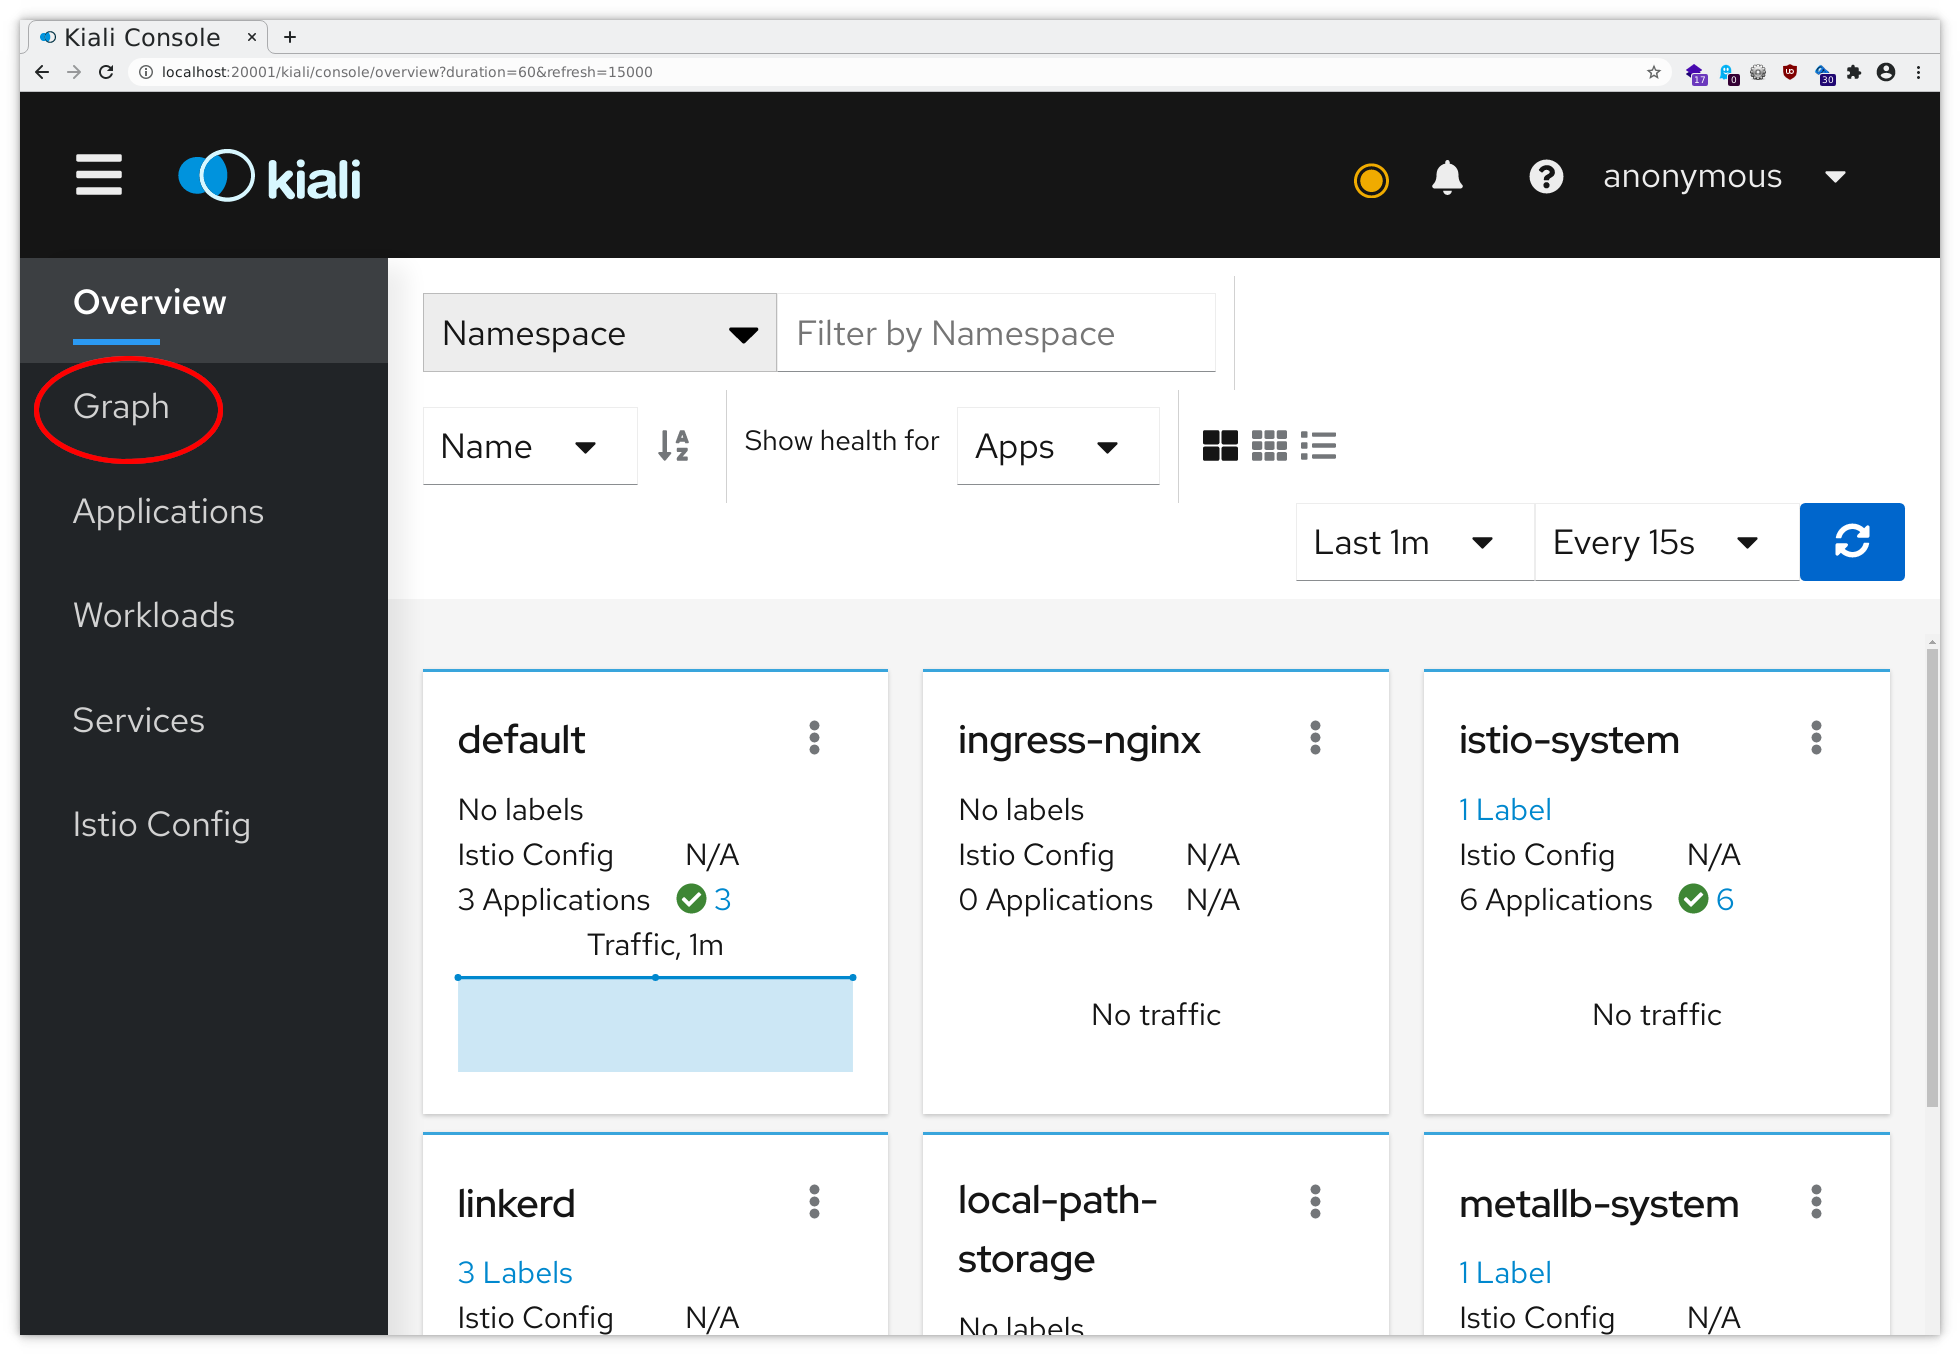
Again, we humans might prefer a different interface for accessing all these data on the fly. For that we can utilize the Kiali web interface.
So let’s open a port-forwarding to this service:
kubectl --namespace istio-system port-forward svc/kiali 20001
Now you can follow the instructions for the port forwarding within your ssh client or Putty . Add a mapping from your local port 20001 to localhost:20001, and then you will be able to access this through your local browser at http://localhost:20001/ , using dual port-forwarding (first via ssh client, then via kubectl), and you should see the application like in the following pictures:
In principle there also are links to Grafana offering lots of insight into various network metrics as well as various Istio metrics and to Jaeger allowing tracing, both provided by the Istio Add-Ons installation, but those are suppressed in our installation as we won’t allow any external access to them (e.g. via Ingress) and will instead rely on port-forwarding via kubectl. More on this later on.
Now click on Graph on the upper left, and then make sure to select your individual Namespace (and only yours) in the Namespace dropdown list and to select Traffic Rate, Traffic Animation and Security in the Display dropdown list. The result should in principle then look somewhat similar to this (don’t compare the graph shape but rather the followed data pathways):
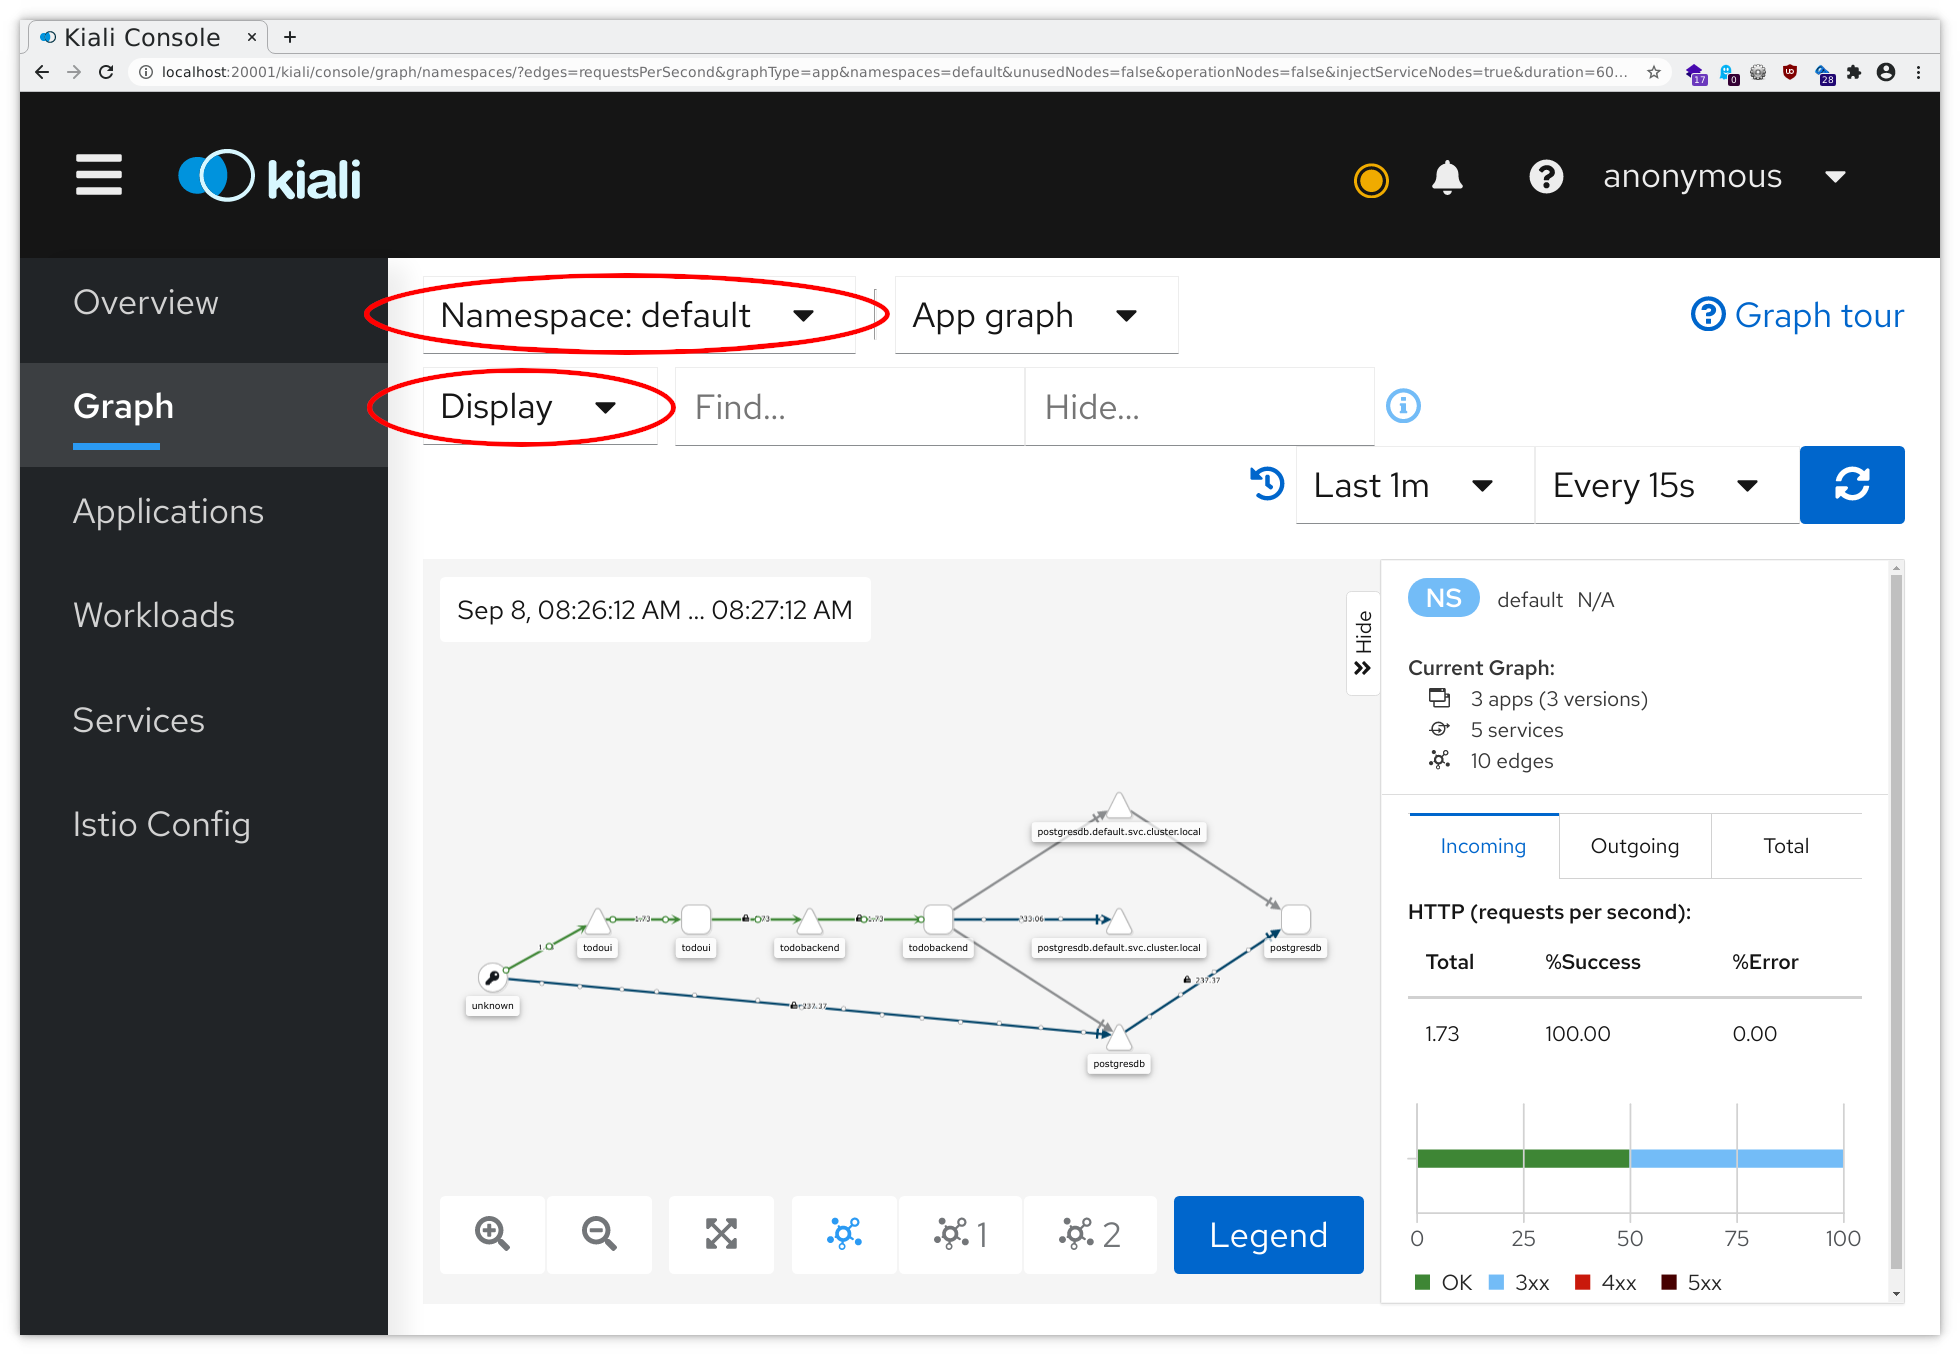
So Istio (as represented by Kiali) already has a vague idea about the topology of our todo application, just by looking at metrics for the generated traffic as collected by the Prometheus Add-On, and provides all this in a nice representation: from unknown there occur accesses to todoui, which in turn contacts todobackend, and there is a database somehow involved. Still, we need to help Istio / Kiali a bit to get further understanding.
First of all, Istio assumes all Service ports are properly named indicating the type of traffic they will receive (e.g. http or tcp-<arbitraryname>, cf. Protocol Selection ). So far we have only minimal information, cf.:
kubectl get service postgresdb -o jsonpath='{.spec.ports}' | jq '.'
[
  {
    "port": 5432,
    "protocol": "TCP",
    "targetPort": 5432
  }
]
In addition, Istio assumes all Services are labeled the same way as their corresponding Deployment in order to sort them together, cf. Pods and Services . But so far we have no Service labels, cf.:
kubectl get service postgresdb -o wide --show-labels
NAME         TYPE        CLUSTER-IP      EXTERNAL-IP   PORT(S)    AGE   SELECTOR         LABELS
postgresdb   ClusterIP   10.108.224.34   <none>        5432/TCP   10d   app=postgresdb   <none>
So let’s fix these two items now by adding Port names and Service labels, allowing Kiali to group some relevant information together:
kubectl patch service postgresdb  --patch '{ "spec": { "ports": [ {"port": 5432, "name": "tcp-postgres" } ] } }'
kubectl patch service todobackend --patch '{ "spec": { "ports": [ {"port": 8080, "name": "http-todobackend" } ] } }'
kubectl patch service todoui      --patch '{ "spec": { "ports": [ {"port": 8090, "name": "http-todoui" } ] } }'
for i in postgresdb todobackend todoui; do kubectl label service $i app=$i; done
And after a short while Kiali will display our application topology somewhat similarly to this (again don’t compare the graph shape but rather the followed data pathways):
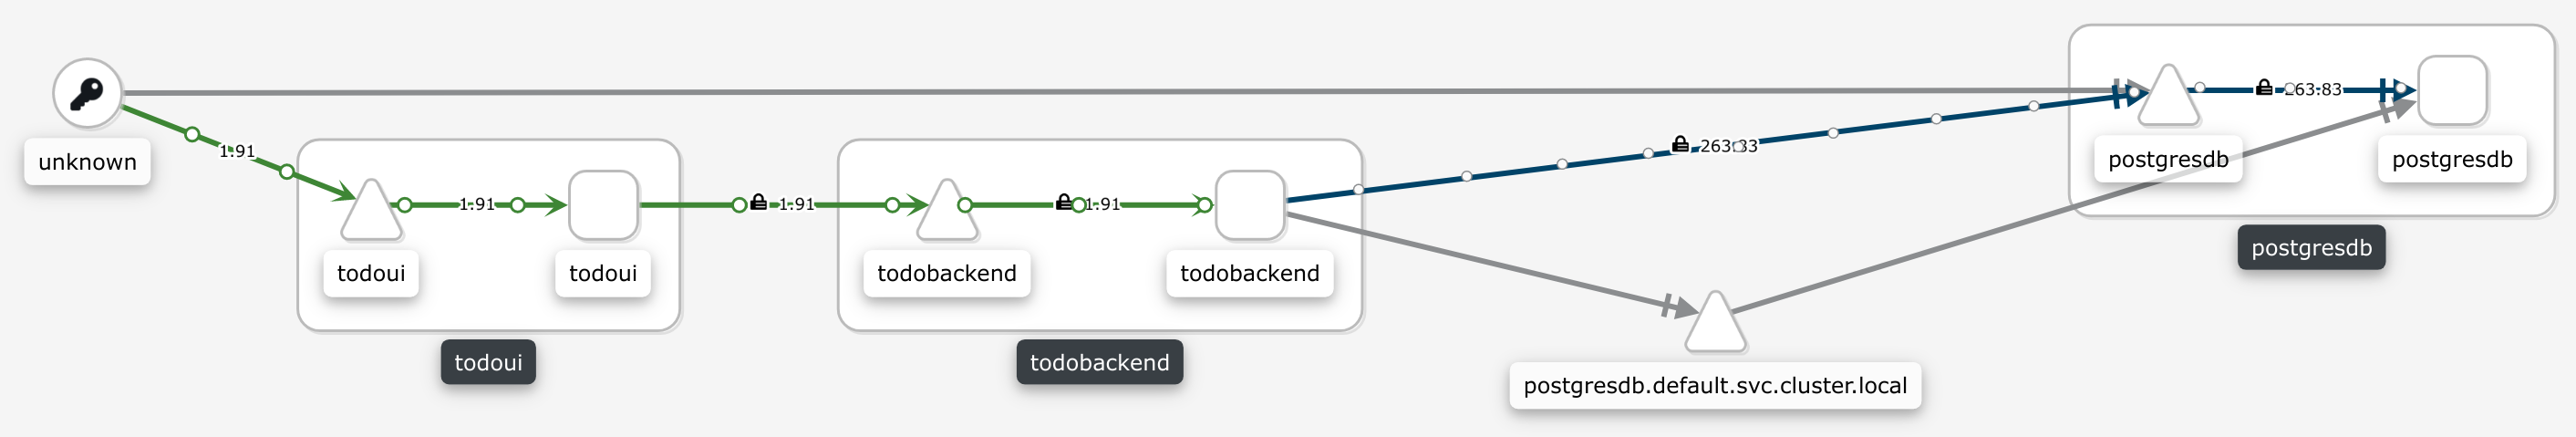
Yes, Kiali will still display now-unused edges in gray until their data will eventually rotate out of monitoring storage, but all the live traffic from our LoadBalancer while loop from above will be attributed correctly: traffic coming in on our LoadBalancer Service, i.e. external to Kubernetes and thus unknown, will reach the todoui Service and then the todoui Deployment Pod, which in turn will contact the todobackend Service and thus the todobackend Deployment Pod, which then contacts the postgresdb Service and thus the postgresdb Deployment Pod.
And as you can see all connections that both originate and end inside Kubernetes are indicated as being secured, i.e. using mutual TLS (mTLS).
Now - before continuing - feel free to browse through Kiali a bit, investigating how the various metrics are available for display. With Istio this is how those metrics should be accessed primarily, but with direct Prometheus and Grafana being available as well. More on the latter later on, and just ignore the Kiali warning about not being able to access Grafana as we have not made that one publicly available.
Exercise - Ingress’ify our ToDo application using Istio
Unlike Linkerd Istio includes its own Ingress implementation. And while using the standard Kubernetes Ingress resources work as well with it, e.g. setting kubernetes.io/ingress.class: istio accordingly, it’s advisable to use the specific Istio resources to achieve best results, as the tight integration allows for some neat functionality.
We will set up this Ingress a bit differently so you can access it directly from your web browser without needing any port-forwarding, which we will then utilize for interactive access later on.
So first let’s create another certificate for our namespaced todo application which now also includes the public IP address of our Istio IngressGateway made accessible via nip.io wildcard DNS, and make it available for Istio:
NAMESPACE=$(kubectl config view --minify --output 'jsonpath={..namespace}'); echo $NAMESPACE
INGRESS_IP_ISTIO=$(kubectl get service --namespace istio-system istio-ingressgateway -o jsonpath='{.status.loadBalancer.ingress[].ip}'); echo $INGRESS_IP_ISTIO
openssl req -x509 -sha256 -nodes -days 365 -newkey rsa:2048 -keyout todo.$NAMESPACE.$INGRESS_IP_ISTIO.nip.io.key -out todo.$NAMESPACE.$INGRESS_IP_ISTIO.nip.io.crt -subj "/CN=todo.$NAMESPACE.$INGRESS_IP_ISTIO.nip.io"
kubectl create secret generic --namespace istio-system todo-istio-$NAMESPACE-tls-secret --from-file key=todo.$NAMESPACE.$INGRESS_IP_ISTIO.nip.io.key --from-file cert=todo.$NAMESPACE.$INGRESS_IP_ISTIO.nip.io.crt
Tip
These variables will be used over and over all through this chapter, but they will not persist over a logout nor will they spread to other separate sessions, so remember to set them again whenever you (re)connect to your user VM.
Yes, the secret needs to be created in the istio-system namespace for the Istio IngressGateway to find it.
With that in place we can configure our namespaced Istio IngressGateway using some Istio-specific resources. First
create todoui-istio.yaml as follows (yes, execute it all at once):
cat <<.EOF > todoui-istio.yaml
apiVersion: networking.istio.io/v1alpha3
kind: Gateway
metadata:
  name: todoui
spec:
  selector:
    istio: ingressgateway
  servers:
    - port:
        number: 80
        name: http
        protocol: HTTP
      hosts:
        - "todo.$NAMESPACE.$INGRESS_IP_ISTIO.nip.io"
      tls:
        httpsRedirect: true
    - port:
        number: 443
        name: https
        protocol: HTTPS
      hosts:
        - "todo.$NAMESPACE.$INGRESS_IP_ISTIO.nip.io"
      tls:
        mode: SIMPLE
        minProtocolVersion: TLSV1_2
        credentialName: todo-istio-$NAMESPACE-tls-secret
---
apiVersion: networking.istio.io/v1alpha3
kind: VirtualService
metadata:
  name: todoui
spec:
  hosts:
    - "todo.$NAMESPACE.$INGRESS_IP_ISTIO.nip.io"
  gateways:
    - todoui
  http:
    - match:
        - uri:
            prefix: /
      route:
        - destination:
            host: todoui.$NAMESPACE.svc.cluster.local
            port:
              number: 8090
.EOF
This matches in principle what we have encountered in the Ingress chapter, with the added twist of this VirtualService resource. More on this later on.
Now apply this file:
kubectl apply -f todoui-istio.yaml
With that set up we can put some load on it. So let’s cancel the while loop pestering the LoadBalancer Service from above and start this one instead:
NAMESPACE=$(kubectl config view --minify --output 'jsonpath={..namespace}'); echo $NAMESPACE
INGRESS_IP_ISTIO=$(kubectl get service --namespace istio-system istio-ingressgateway -o jsonpath='{.status.loadBalancer.ingress[].ip}'); echo $INGRESS_IP_ISTIO
CURL="curl --silent --insecure"
TODO='NEW_TODO_Istio'
while sleep 1; do
    $CURL https://todo.$NAMESPACE.$INGRESS_IP_ISTIO.nip.io/      --data toDo=$TODO    # i.e. POST for creating an entry followed by GET for listing
    sleep 1
    $CURL https://todo.$NAMESPACE.$INGRESS_IP_ISTIO.nip.io/$TODO --data value='Done!' # i.e. POST for deleting an entry followed by GET for listing
    date
done # > /dev/null
And of course you are free to access this https://todo.$NAMESPACE.$INGRESS_IP_ISTIO.nip.io/ from anywhere in the
world, it is publicly available: echo "Go to this address: https://todo.$NAMESPACE.$INGRESS_IP_ISTIO.nip.io/". Beware
that we are using a self-signed certificate, though …
Kiali will eventually display the topology somewhat similarly to this:
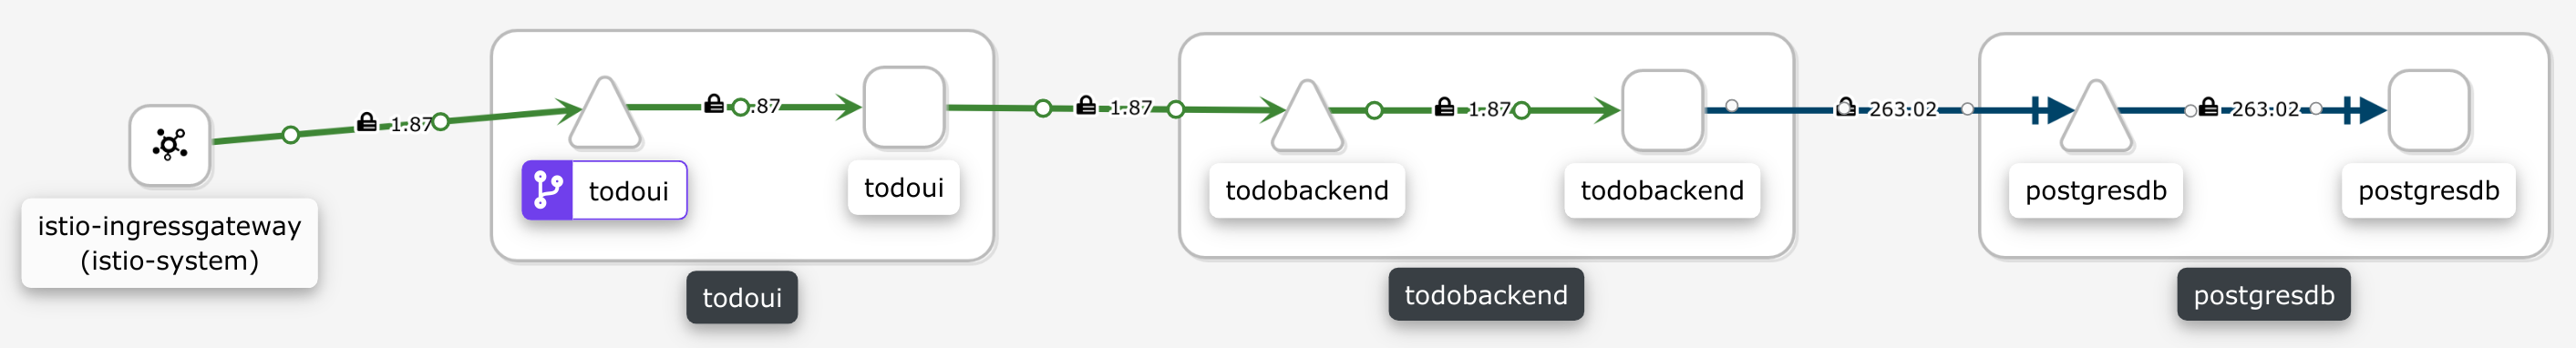
So by now all connection edges right from traffic entering the cluster at the IngressGateway all the way down to the postgresdb will be secured. And the icon on the todoui Service denotes the VirtualService resource we had just created which we will further utilize now.
Exercise - Replace our todoui component with versioned Deployments
As the MatchLabels field is immutable we cannot simply adjust our current todoui deployment, so let’s delete it and create it anew with slightly different parameters as follows (yes, execute it all at once):
cat <<.EOF > todoui-versioned-0-2.yaml
apiVersion: apps/v1
kind: Deployment
metadata:
  name: todoui-0-2
spec:
  replicas: 1
  selector:
    matchLabels:
      app: todoui
      version: "0.2"
  template:
    metadata:
      name: todoui
      labels:
        app: todoui
        tier: frontend
        version: "0.2"
    spec:
      containers:
        - name: todoui
          image: novatec/technologyconsulting-containerexerciseapp-todoui:v0.2
      restartPolicy: Always
.EOF
The only differences are the name now having the version appended and the additional version: “0.2” label and selector. Well, and actually using a new image version which introduces Feature Flag Cookie: Create | Delete links that we are going to make use of later on. All of which won’t hinder the todoui Service or the todoui VirtualService as provided by Istio to still find the Pods belonging to this Deployment.
So now let’s delete the current Deployment and create it anew as given above, but additionally with injected Istio data plane proxy which is added automatically as we had labeled our namespace accordingly:
kubectl delete deployment todoui && kubectl apply -f todoui-versioned-0-2.yaml
Except for a small hiccup during Pod creation our todo application remained accessible. And now we strive to avoid even this small hiccup, and doing that even more controlled than we had exercised in the Runtime chapter with readinessProbe and rolling deployment .
But first, please create a corresponding todoui-versioned-0-3.yaml now, i.e. a file deploying a future version:
“0.3” of the todoui component. How would that look like?
And what would happen if we were to apply this now without any further ado?
So, let’s postpone applying this and prepare our VirtualService first (yes, execute it all at once):
cat <<.EOF > todoui-istio-routing.yaml
apiVersion: networking.istio.io/v1alpha3
kind: DestinationRule
metadata:
  name: todoui
spec:
  host: todoui.$NAMESPACE.svc.cluster.local
  trafficPolicy:
    tls:
      mode: ISTIO_MUTUAL
  subsets:
    - name: v0-2
      labels:
        app: todoui
        version: "0.2"
    - name: v0-3
      labels:
        app: todoui
        version: "0.3"
---
apiVersion: networking.istio.io/v1alpha3
kind: VirtualService
metadata:
  name: todoui
spec:
  hosts:
    - "todo.$NAMESPACE.$INGRESS_IP_ISTIO.nip.io"
  gateways:
    - todoui
  http:
    - match:
        - uri:
            prefix: /
      route:
        - destination:
            host: todoui.$NAMESPACE.svc.cluster.local
            subset: v0-2
            port:
              number: 8090
.EOF
The DestinationRule defines two subsets for our todoui component each with a matching set of specific labels, and the VirtualService now references the v0-2 subset, in essence directing all traffic to the corresponding Deployment even if another one is present. And the trafficPolicy ensures that mTLS will be available.
Now apply this file:
kubectl apply -f todoui-istio-routing.yaml
And then apply the version: “0.3” file you had prepared above, additionally with auto-injected Istio data plane proxy:
kubectl apply -f todoui-versioned-0-3.yaml
Once the Pod is running take a look at Kiali’s graph, but in the App graph dropdown switch to Versioned app graph and in the Display dropdown change within Show Edge Labels to display only Traffic Distribution now, and you will notice that still no traffic from our while loop pestering the Istio IngressGateway will reach the todoui-0-3 Deployment yet, just as we had configured above. It might eventually look like this once you have tried accessing it via various pathways:
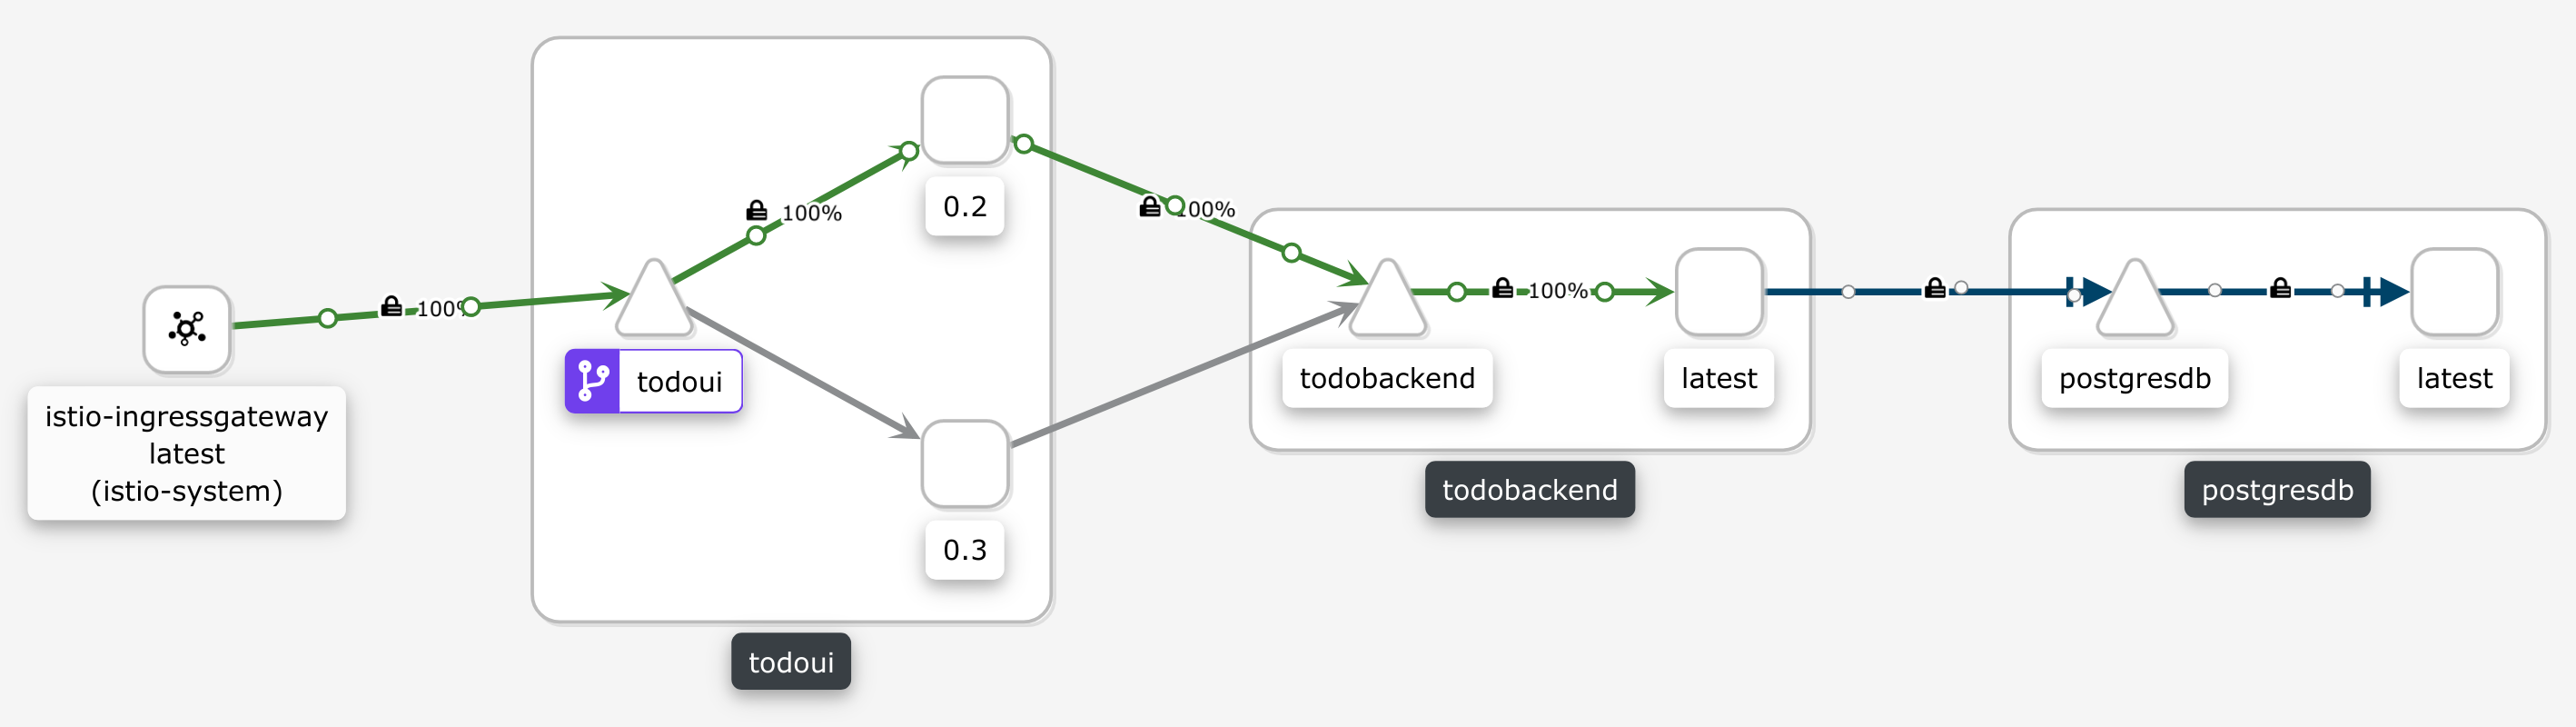
However, when you access using the LoadBalancer Service, Nginx Ingress, or Traefik Ingress you will find that via these pathways you will randomly get differing results, like we pondered above. Try for yourself as follows.
First, export the required variables:
export NAMESPACE=$(kubectl config view --minify --output 'jsonpath={..namespace}'); echo $NAMESPACE
export LOADBALANCER_IP=$(kubectl get svc todoui -o jsonpath="{.status.loadBalancer.ingress[0].ip}"); echo $LOADBALANCER_IP
export INGRESS_IP_NGINX=$(kubectl get ingress todo-nginx -o jsonpath='{.status.loadBalancer.ingress[].ip}'); echo $INGRESS_IP_NGINX
export INGRESS_IP_TRAEFIK=$(kubectl get ingress todo-traefik -o jsonpath='{.status.loadBalancer.ingress[].ip}'); echo $INGRESS_IP_TRAEFIK
export CURL="curl --silent --location --insecure"
Then execute any of the following lines (Ctrl+C to cancel execution):
while sleep 1; do date; $CURL http://$LOADBALANCER_IP:8090                       | grep ':-)'; done
while sleep 1; do date; $CURL http://todo.$NAMESPACE.$INGRESS_IP_NGINX.nip.io/   | grep ':-)'; done
while sleep 1; do date; $CURL http://todo.$NAMESPACE.$INGRESS_IP_TRAEFIK.nip.io/ | grep ':-)'; done
and you will find that about half of the results will display a placeholder and half will display the actual current count of ToDo(s), like this:
Fr 19. Jan 11:34:34 CET 2024
                <td>You have <span th:text="${#lists.size(items)}" /> ToDo(s) :-)</td>
Fr 19. Jan 11:34:35 CET 2024
                <td>You have <span >4</span> ToDo(s) :-)</td>
Fr 19. Jan 11:34:36 CET 2024
                <td>You have <span >4</span> ToDo(s) :-)</td>
Fr 19. Jan 11:34:37 CET 2024
                <td>You have <span th:text="${#lists.size(items)}" /> ToDo(s) :-)</td>
Fr 19. Jan 11:34:38 CET 2024
                <td>You have <span th:text="${#lists.size(items)}" /> ToDo(s) :-)</td>
The placeholder results are from the todoui-0-2 Deployment where this counting feature is not yet active (but already present as commented-out markup), and those with an actual count are what the todoui-0-3 Deployment provides.
As was to be expected these other access pathways don’t understand the additional definitions we had applied for Istio.
Exercise - Lock down our todo application
Let’s define corresponding DestinationRule and VirtualService resources for the todobackend and the postgresdb Deployments now (yes, execute it all at once):
cat <<.EOF > todoui-istio-routing-others.yaml
apiVersion: networking.istio.io/v1alpha3
kind: DestinationRule
metadata:
  name: todobackend
spec:
  host: todobackend.$NAMESPACE.svc.cluster.local
  trafficPolicy:
    tls:
      mode: ISTIO_MUTUAL
  subsets:
    - name: v0-2
      labels:
        app: todobackend
---
apiVersion: networking.istio.io/v1alpha3
kind: VirtualService
metadata:
  name: todobackend
spec:
  hosts:
    - todobackend.$NAMESPACE.svc.cluster.local
  http:
    - match:
        - sourceLabels:
            app: todoui
      route:
        - destination:
            host: todobackend.$NAMESPACE.svc.cluster.local
            subset: v0-2
            port:
              number: 8080
---
apiVersion: networking.istio.io/v1alpha3
kind: DestinationRule
metadata:
  name: postgresdb
spec:
  host: postgresdb.$NAMESPACE.svc.cluster.local
  trafficPolicy:
    tls:
      mode: ISTIO_MUTUAL
  subsets:
    - name: v0-1
      labels:
        app: postgresdb
---
apiVersion: networking.istio.io/v1alpha3
kind: VirtualService
metadata:
  name: postgresdb
spec:
  hosts:
    - postgresdb.$NAMESPACE.svc.cluster.local
  tcp:
    - match:
        - sourceLabels:
            app: todobackend
      route:
        - destination:
            host: postgresdb.$NAMESPACE.svc.cluster.local
            subset: v0-1
            port:
              number: 5432
.EOF
The DestionationRules are comparable to what we have seen for todoui already, but there is a twist in these VirtualService definitions: they also contain a sourceLabels match each limiting access to the previous tier in our application stack.
So far so good. And now for the final twist let’s append enforcing strict mTLS between all tiers (yes, execute it all at once):
cat <<.EOF >> todoui-istio-routing-others.yaml
---
apiVersion: security.istio.io/v1beta1
kind: PeerAuthentication
metadata:
  name: default
spec:
  mtls:
    mode: STRICT
.EOF
Apply this file:
kubectl apply -f todoui-istio-routing-others.yaml
and you will find you cannot access the todoui using the LoadBalancer Service, Nginx Ingress or Traefik Ingress anymore but only via Istio Ingress.
Strict mTLS means exactly that: only those that are mutually authenticated as defined in the DestinationRule and VirtualService definitions are allowed to access. The Istio IngressGateway is implicitly authenticated as general authentication is automatically provided by Istio, and for the other components we have added the appropriate authorization rules ourselves, effectively locking down our todo application to just the predefined access pathway.
Exercise - Make the versioned Deployments available
Now how can we make the todoui-0-3 Deployment gradually available so that we can test it? Of course, in our small environment here we could just go live with it, but what if it was an important web service whose correct functioning is essential for our business. Yes, naturally we have a plethora of integration tests and automated or manual QA completed before we eventually deploy a new version to prod (right?!), but do we still dare to just let it loose on the general public?
Let’s just make it available to a subset of access requests for now, just to be on the safe side (yes, execute it all at once):
cat <<.EOF > todoui-istio-routing-canary.yaml
apiVersion: networking.istio.io/v1alpha3
kind: VirtualService
metadata:
  name: todoui
spec:
  hosts:
    - "todo.$NAMESPACE.$INGRESS_IP_ISTIO.nip.io"
  gateways:
    - todoui
  http:
    - match:
        - uri:
            prefix: /
      route:
        - destination:
            host: todoui.$NAMESPACE.svc.cluster.local
            subset: v0-3
            port:
              number: 8090
          weight: 10
        - destination:
            host: todoui.$NAMESPACE.svc.cluster.local
            subset: v0-2
            port:
              number: 8090
          weight: 90
.EOF
The change here is that we add a destination route for the v0-3 subset as previously defined, but we also assign weights to each route.
Apply this file:
kubectl apply -f todoui-istio-routing-canary.yaml
and check what our Istio IngressGateway will now yield:
NAMESPACE=$(kubectl config view --minify --output 'jsonpath={..namespace}'); echo $NAMESPACE
INGRESS_IP_ISTIO=$(kubectl get service --namespace istio-system istio-ingressgateway -o jsonpath='{.status.loadBalancer.ingress[].ip}'); echo $INGRESS_IP_ISTIO
CURL="curl --silent --location --insecure"
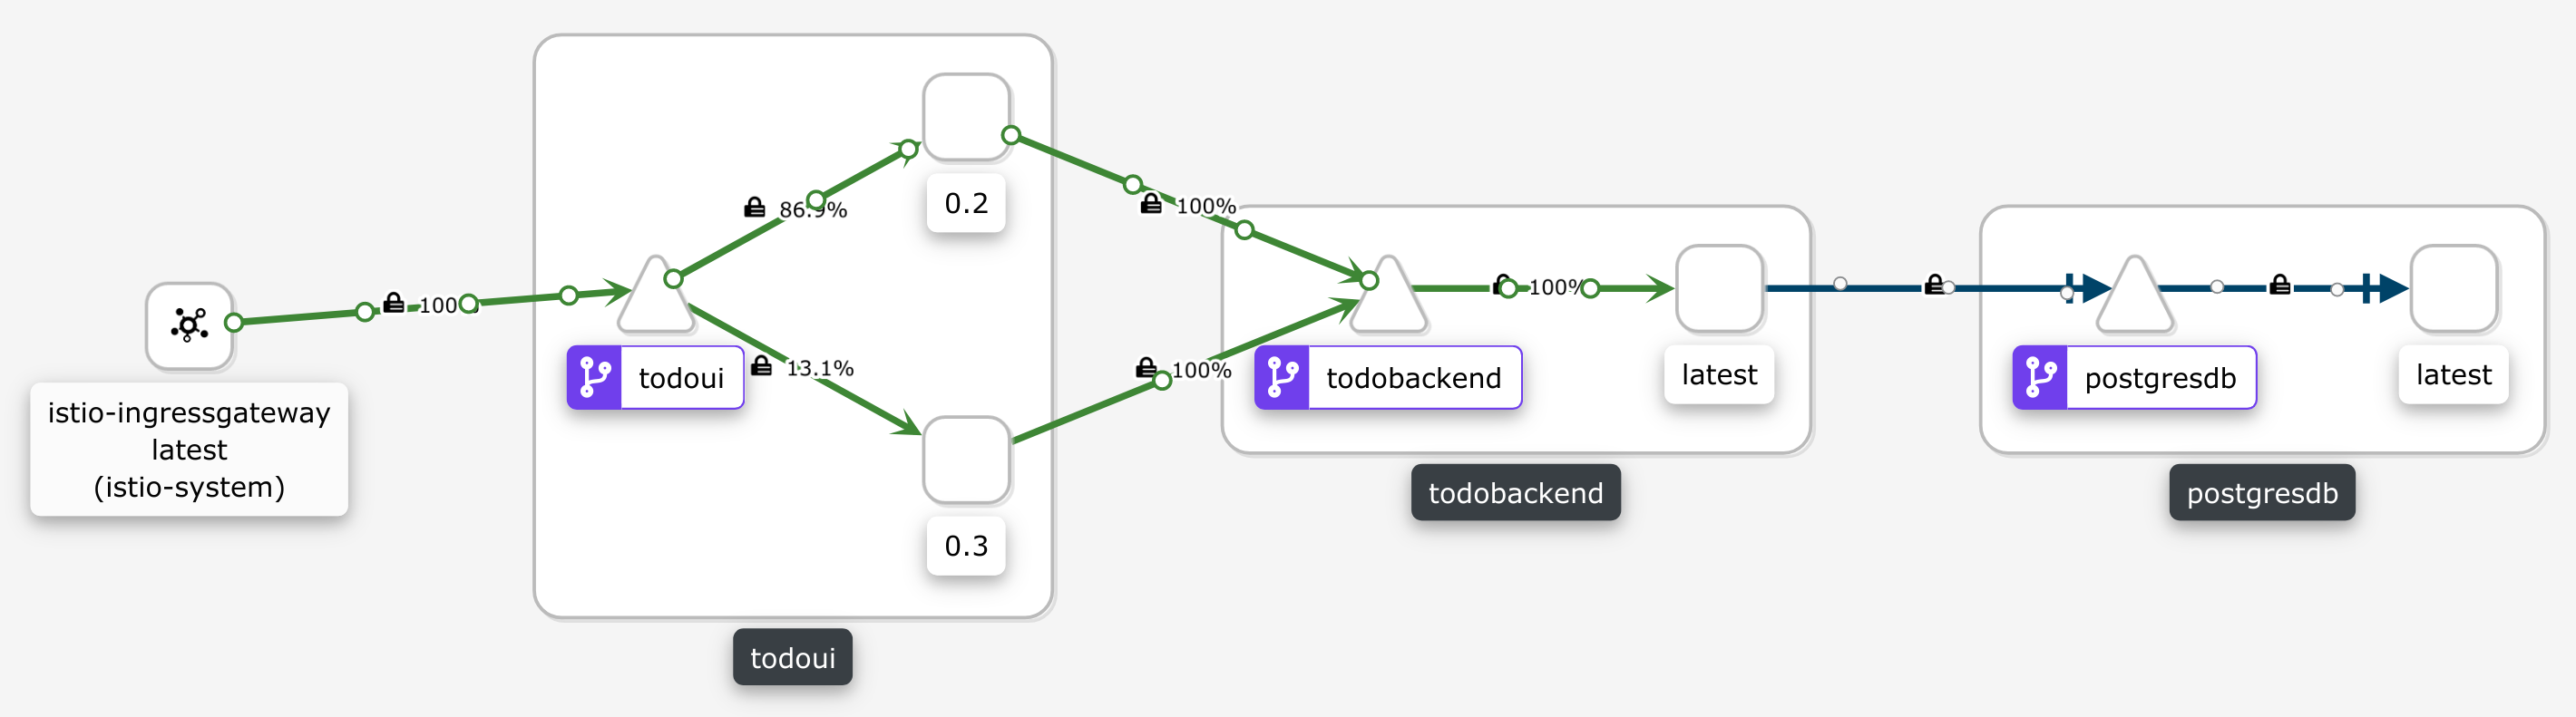
while sleep 1; do date; $CURL https://todo.$NAMESPACE.$INGRESS_IP_ISTIO.nip.io/ | grep ':-)'; doneYou will find that about one out of ten requests will show the actual ToDo count as yielded by the v0-3 subset, and the others will just display the placeholder from the v0-2 subset, corresponding with the destination route weights we have assigned above.
Take a look at Kiali’s graph and you will eventually see this ratio represented there as well, like this
In a prod deployment now would be a great time to meticulously study our monitoring to see whether the newly deployed application version shows any erratic behavior in success rate, response times / latency or anything else deemed worthy of checking, and if not we would gradually shift more and more traffic over until finally all requests will be served by the new version. This procedure is called a Canary Deployment: just like back in the coal mines let’s have some test subject which we can examine whether everything is as it should.
Now, for another option, let’s create an Opt-In Canary: allow users to become beta testers by opting in to use the newest version of our application, individually controlled by setting a corresponding cookie (yes, execute it all at once).
cat <<.EOF > todoui-istio-routing-cookie.yaml
apiVersion: networking.istio.io/v1alpha3
kind: VirtualService
metadata:
  name: todoui
spec:
  hosts:
    - "todo.$NAMESPACE.$INGRESS_IP_ISTIO.nip.io"
  gateways:
    - todoui
  http:
    - match:
        - uri:
            prefix: /
          headers:
            cookie:
              regex: "^(.*?; ?)?(featureflag=on)(;.*)?$"
      route:
        - destination:
            host: todoui.$NAMESPACE.svc.cluster.local
            subset: v0-3
            port:
              number: 8090
    - match:
        - uri:
            prefix: /
      route:
        - destination:
            host: todoui.$NAMESPACE.svc.cluster.local
            subset: v0-2
            port:
              number: 8090
.EOF
The change here is that we check for a certain cookie in the request headers, and if found the v0-3 subset will be used and the v0-2 one otherwise.
Apply this file:
kubectl apply -f todoui-istio-routing-cookie.yaml
and if you repeat the while loop we had just executed above you will find that all requests will not yield the actual
ToDo count anymore until we add the --cookie 'featureflag=on' parameter to the curl invocation.
Feel free to test this in your browser as well where you can finally make good use of the Feature Flag Cookie: Create | Delete links on the todoui … ;-)
Of course, in principle both options could be combined: of those users that have opted-in to beta testing, initially only a small percentage actually gets to see the new release, but while all monitoring checks are staying green more and more traffic will be shifted, until eventually the same traffic shifting will be enabled for all users. And at any time
- in case of any troubles - the new release can be disabled, limiting impact of any issues.
Reality check and further outlook
Please note that while the features showcased here so far for Istio are indeed neat, they are not all unique to Istio. A canary deployment, weighted or opt-in, can be conducted using Linkerd as well, even with automated shifting of traffic over to the new release as long as predefined metrics stay at a sane level, cf. Progressive Delivery | Linkerd .
And the common Ingress Controllers can act similarly, albeit of course only at the Ingress level and not at arbitrary places inside our cluster network. You will find samples for the latter at the end of this chapter for Nginx and Traefik , just for the sake of comparison.
Still, Istio provides the widest set of features for any Service Mesh: starting with what we have seen already, i.e. including an Ingress Controller on its own, various metrics and observability means, request routing and traffic shifting, service authentication and authorization, you also get
- fault injection to test the resiliency of your application
- rate limiting to dynamically limit the traffic to a service
- request timeouts and circuit breaking to limit the impact of failures, latency spikes, and other undesirable effects of network peculiarities
- traffic mirroring for out of band copying of traffic to test new services
- egress gateways for filtering which external services should be reachable
See Istio / Next Steps for getting started on these.
Exercise - Distributed tracing
Even without code changes and specific configuration Istio already allows some further insight into where requests spend their time. This is made possible by the data plane proxies occasionally injecting tracing data into HTTP requests that can then be handled using Jaeger. Of course not all requests are traced as that would incur considerable overhead, but given enough time even at a low sample rate all relevant access pathways can be examined.
While the Kiali UI already displays some trace data on its own, a Jaeger UI is available as well.
So let’s open a port-forwarding to this service:
kubectl --namespace istio-system port-forward svc/tracing 18080:80
Now you can follow the instructions for the port forwarding within your ssh client or Putty . Add a mapping from your local port 18080 to localhost:18080, and then you will be able to access this through your local browser at http://localhost:18080/ , using dual port-forwarding (first via ssh client, then via kubectl), and you should see the application like in the following picture:
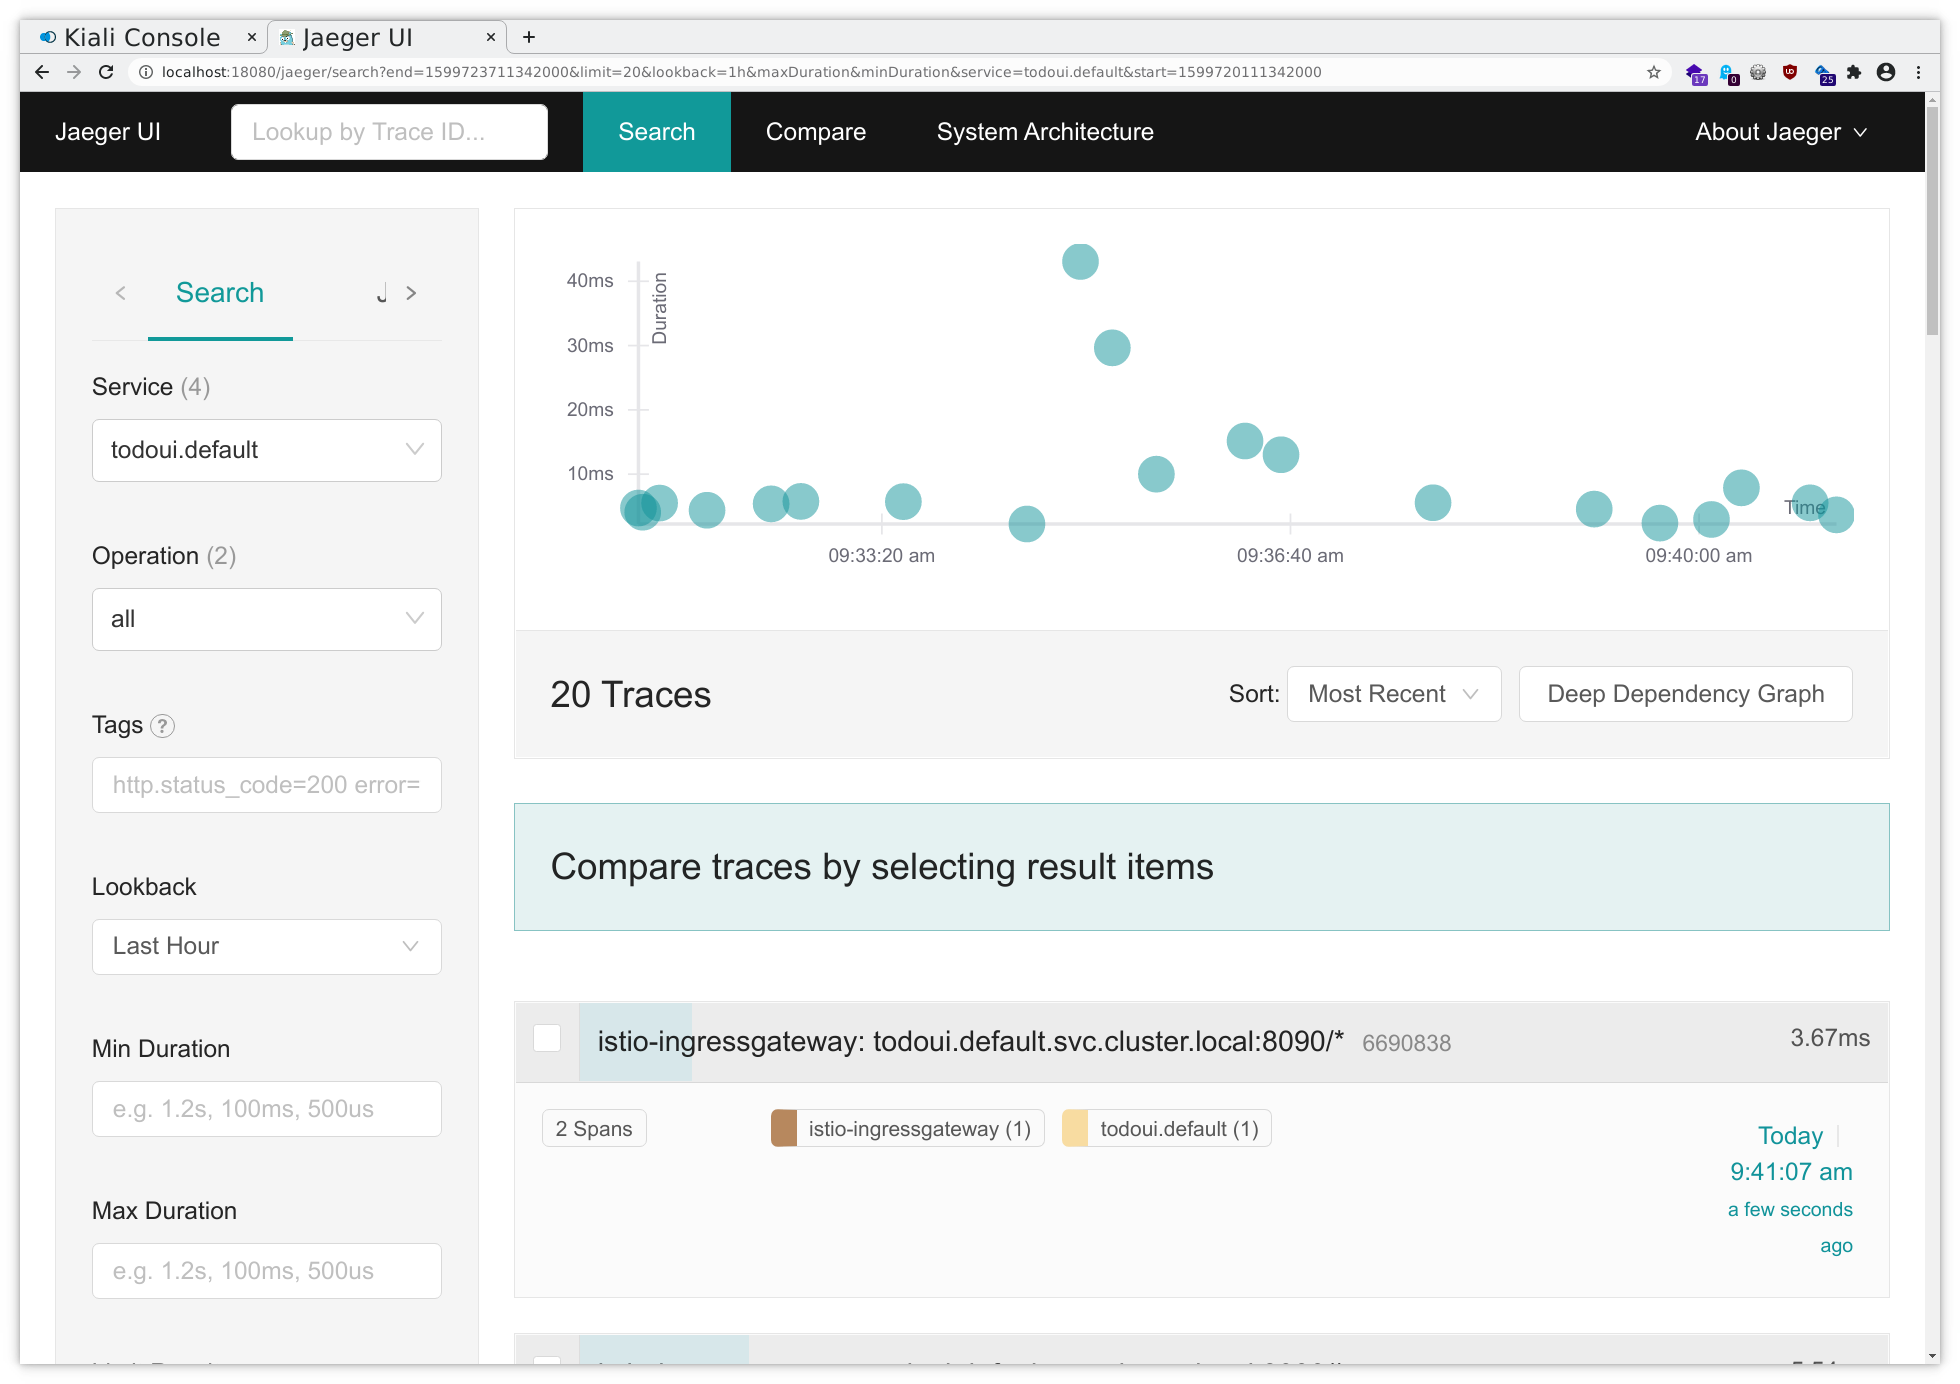
Select todoui.<your_namespace> in the Service dropdown in the upper left corner and then click on Find Traces all the way down in the down left corner and you will get an overview over the most recent traces related to your service, seeing some from the IngressGateway to your todoui service and some from your todoui service to your todobackend service:
And clicking on a sample will yield something like the following, illustrating in which application component a specific request was handled for how long:
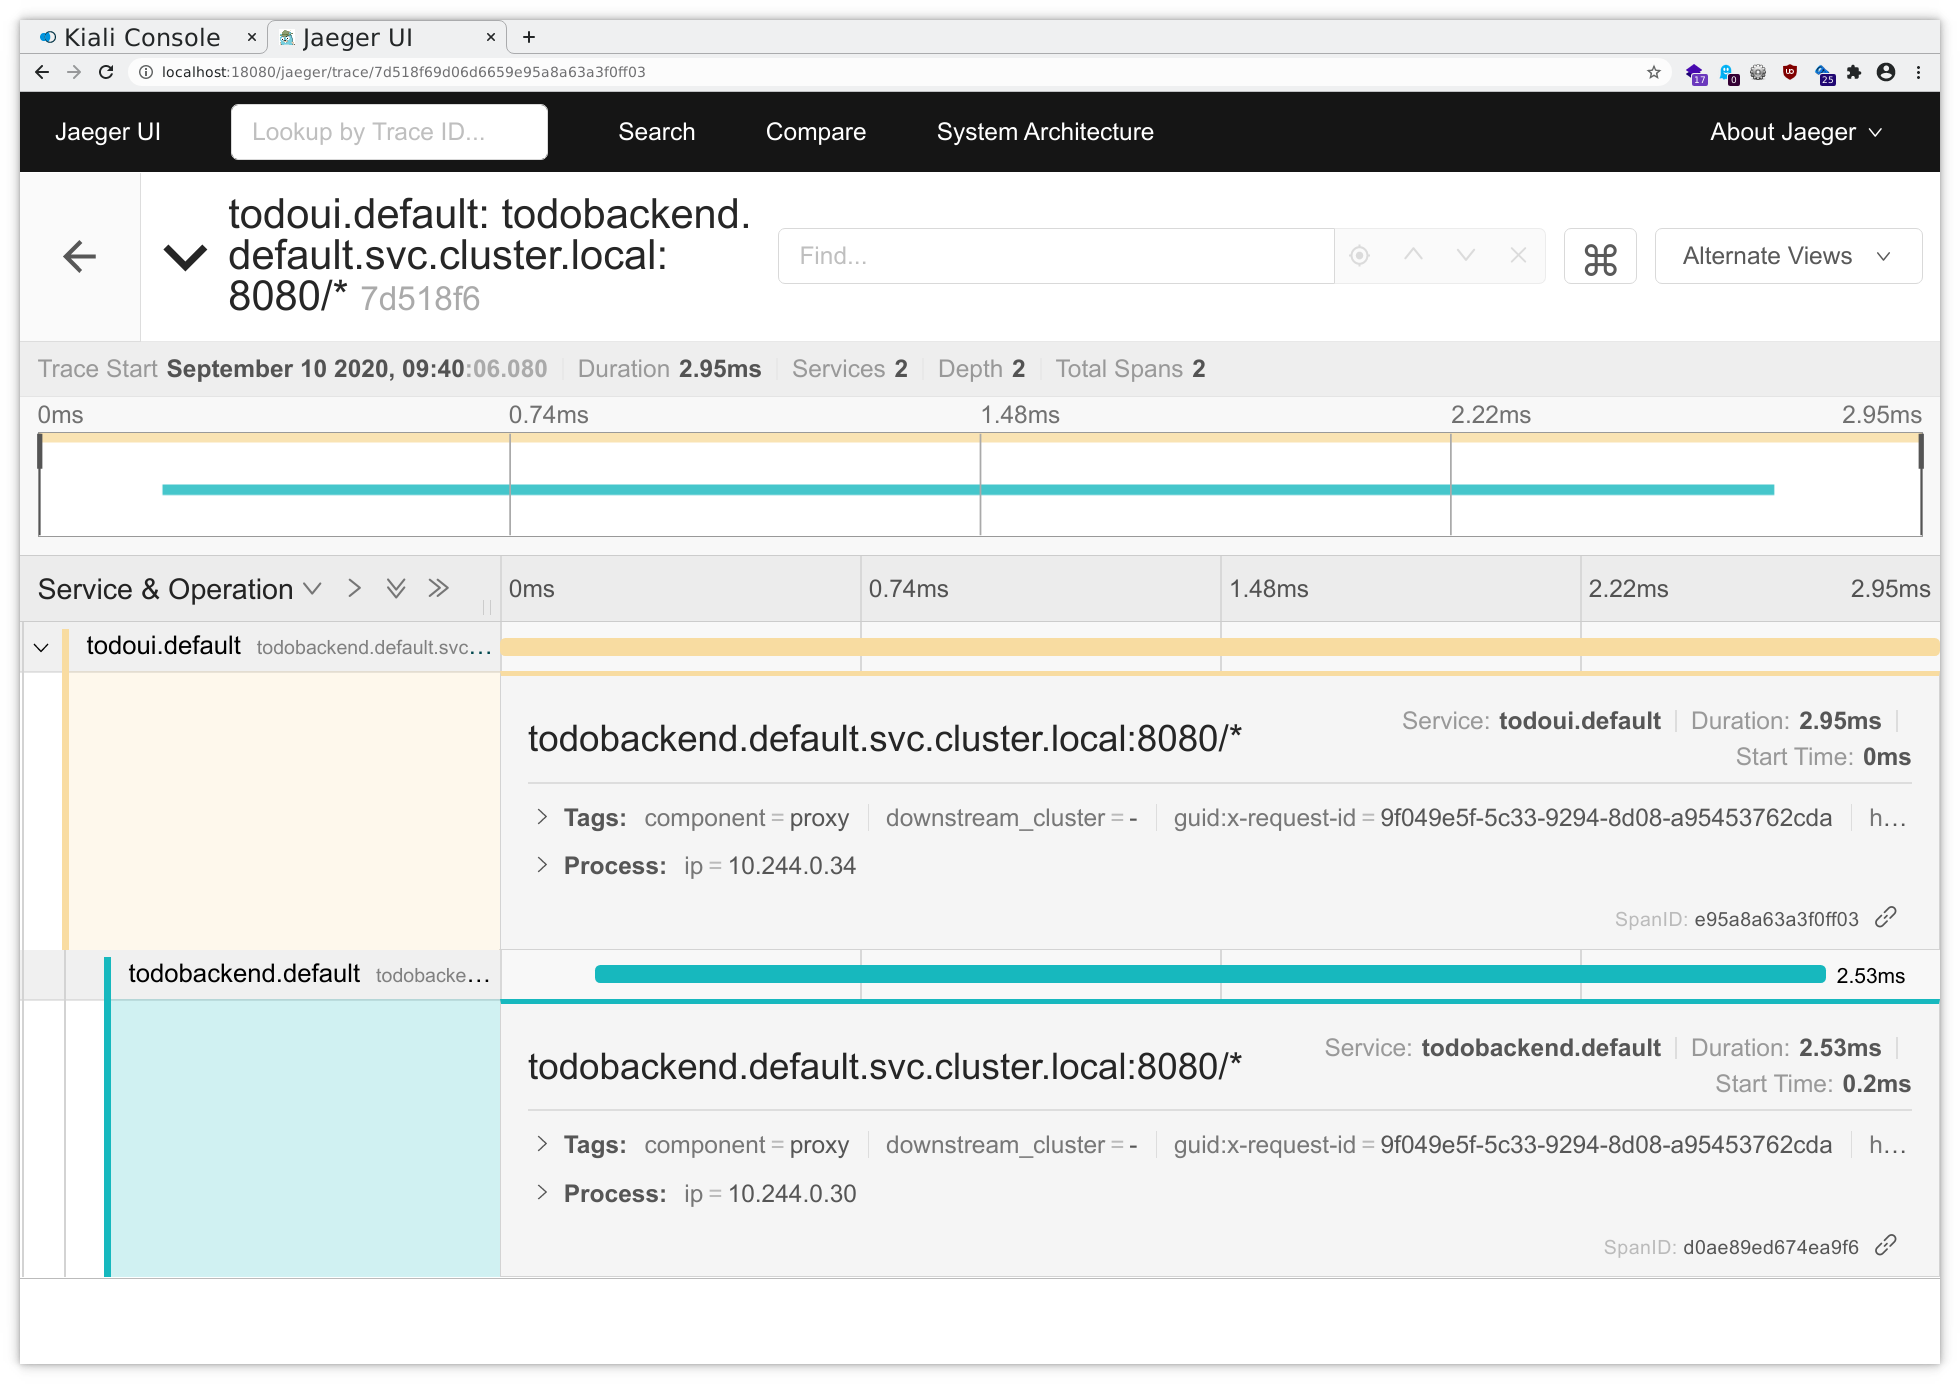
Here you can see that the majority of time spent accessing the todoui service was actually spent in the todoui in turn accessing the todobackend service.
Exercise - Observability
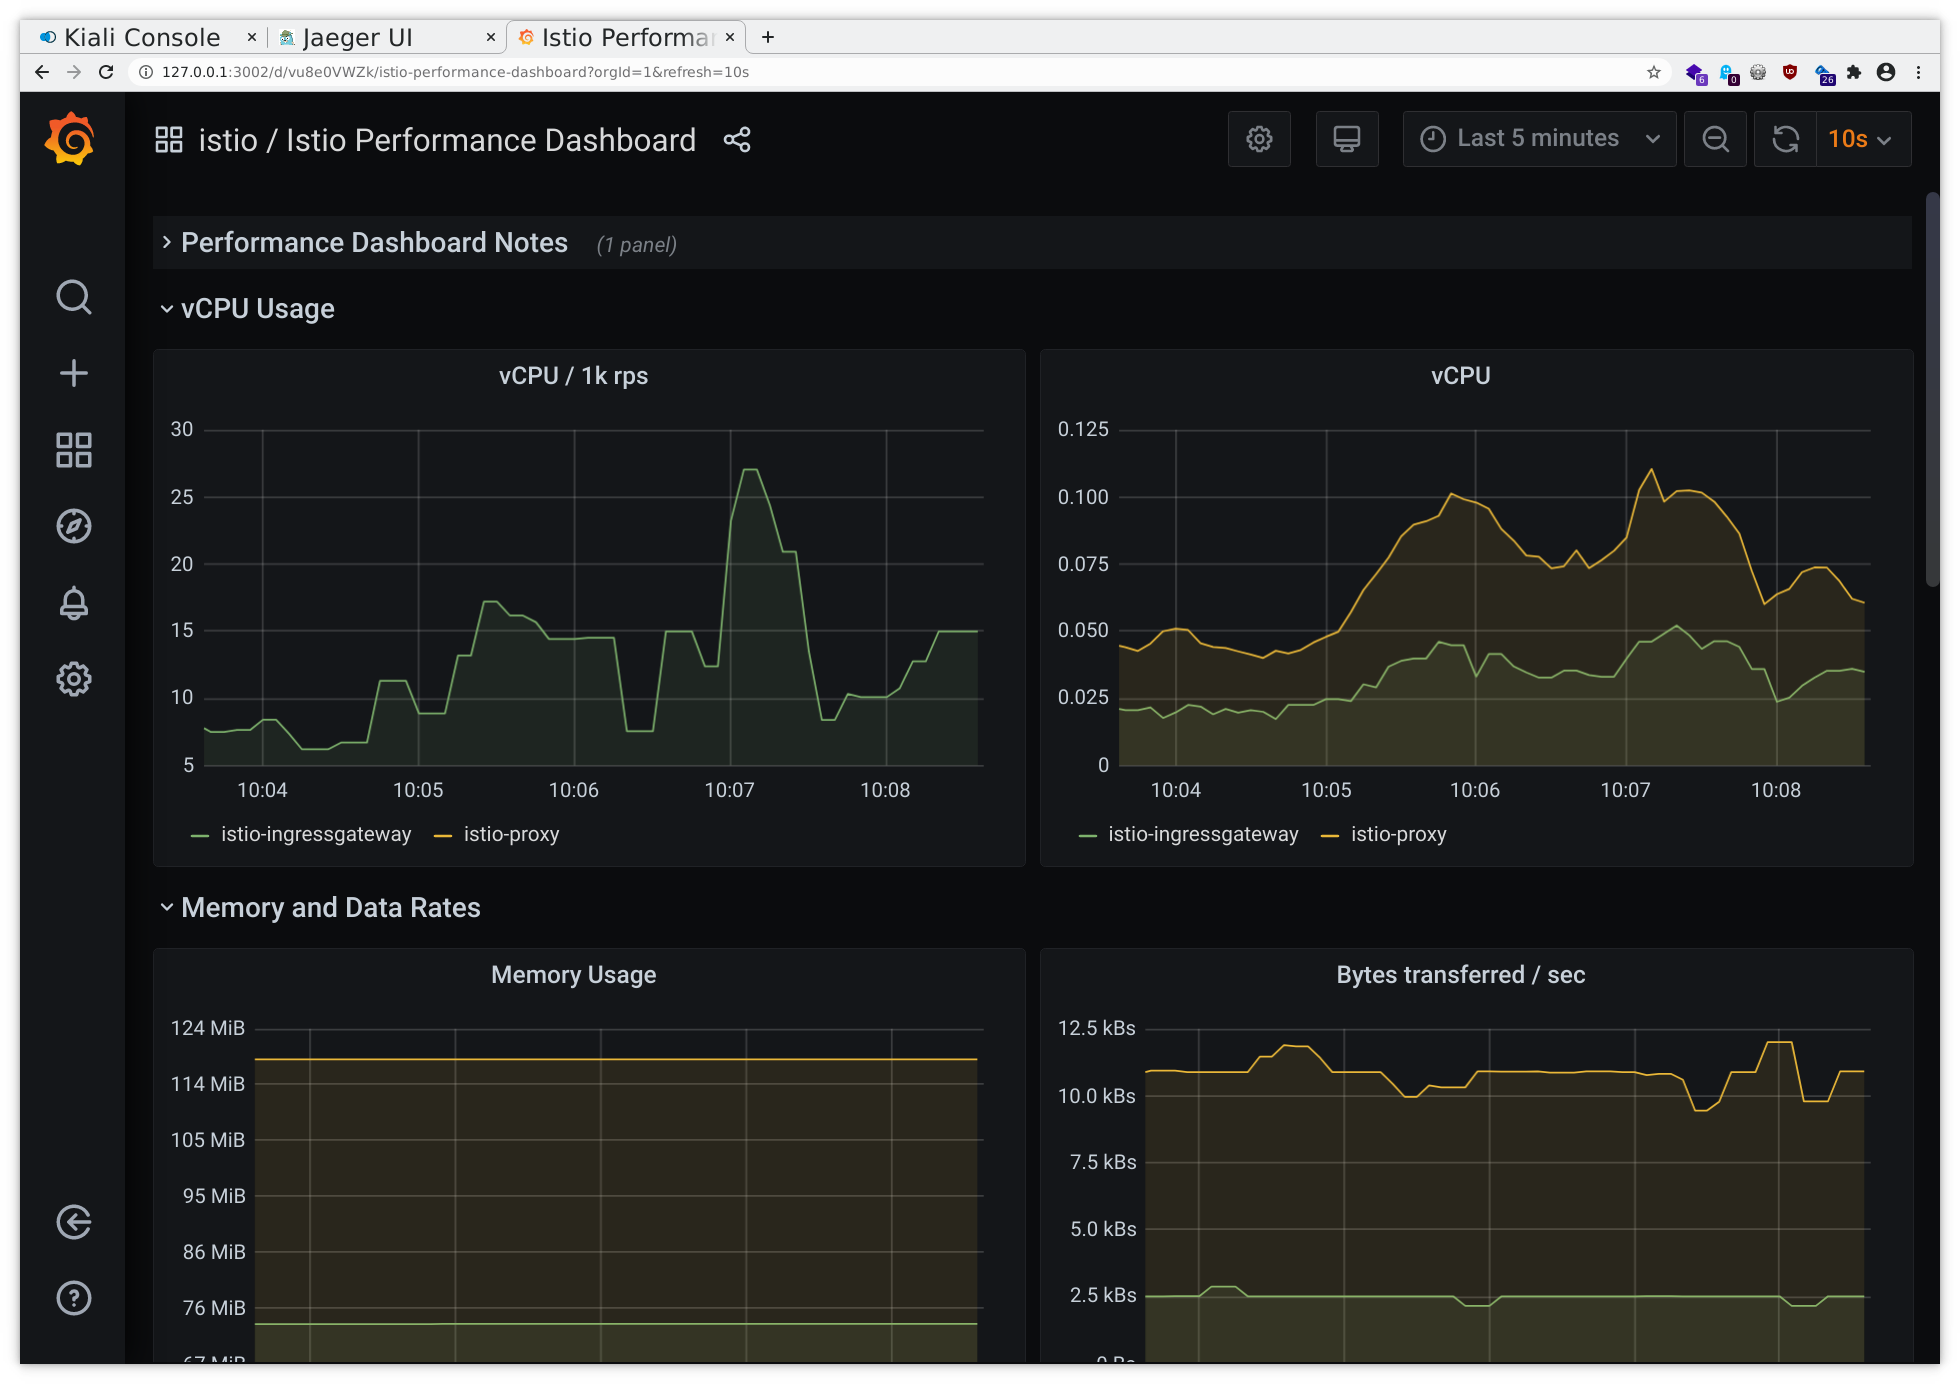
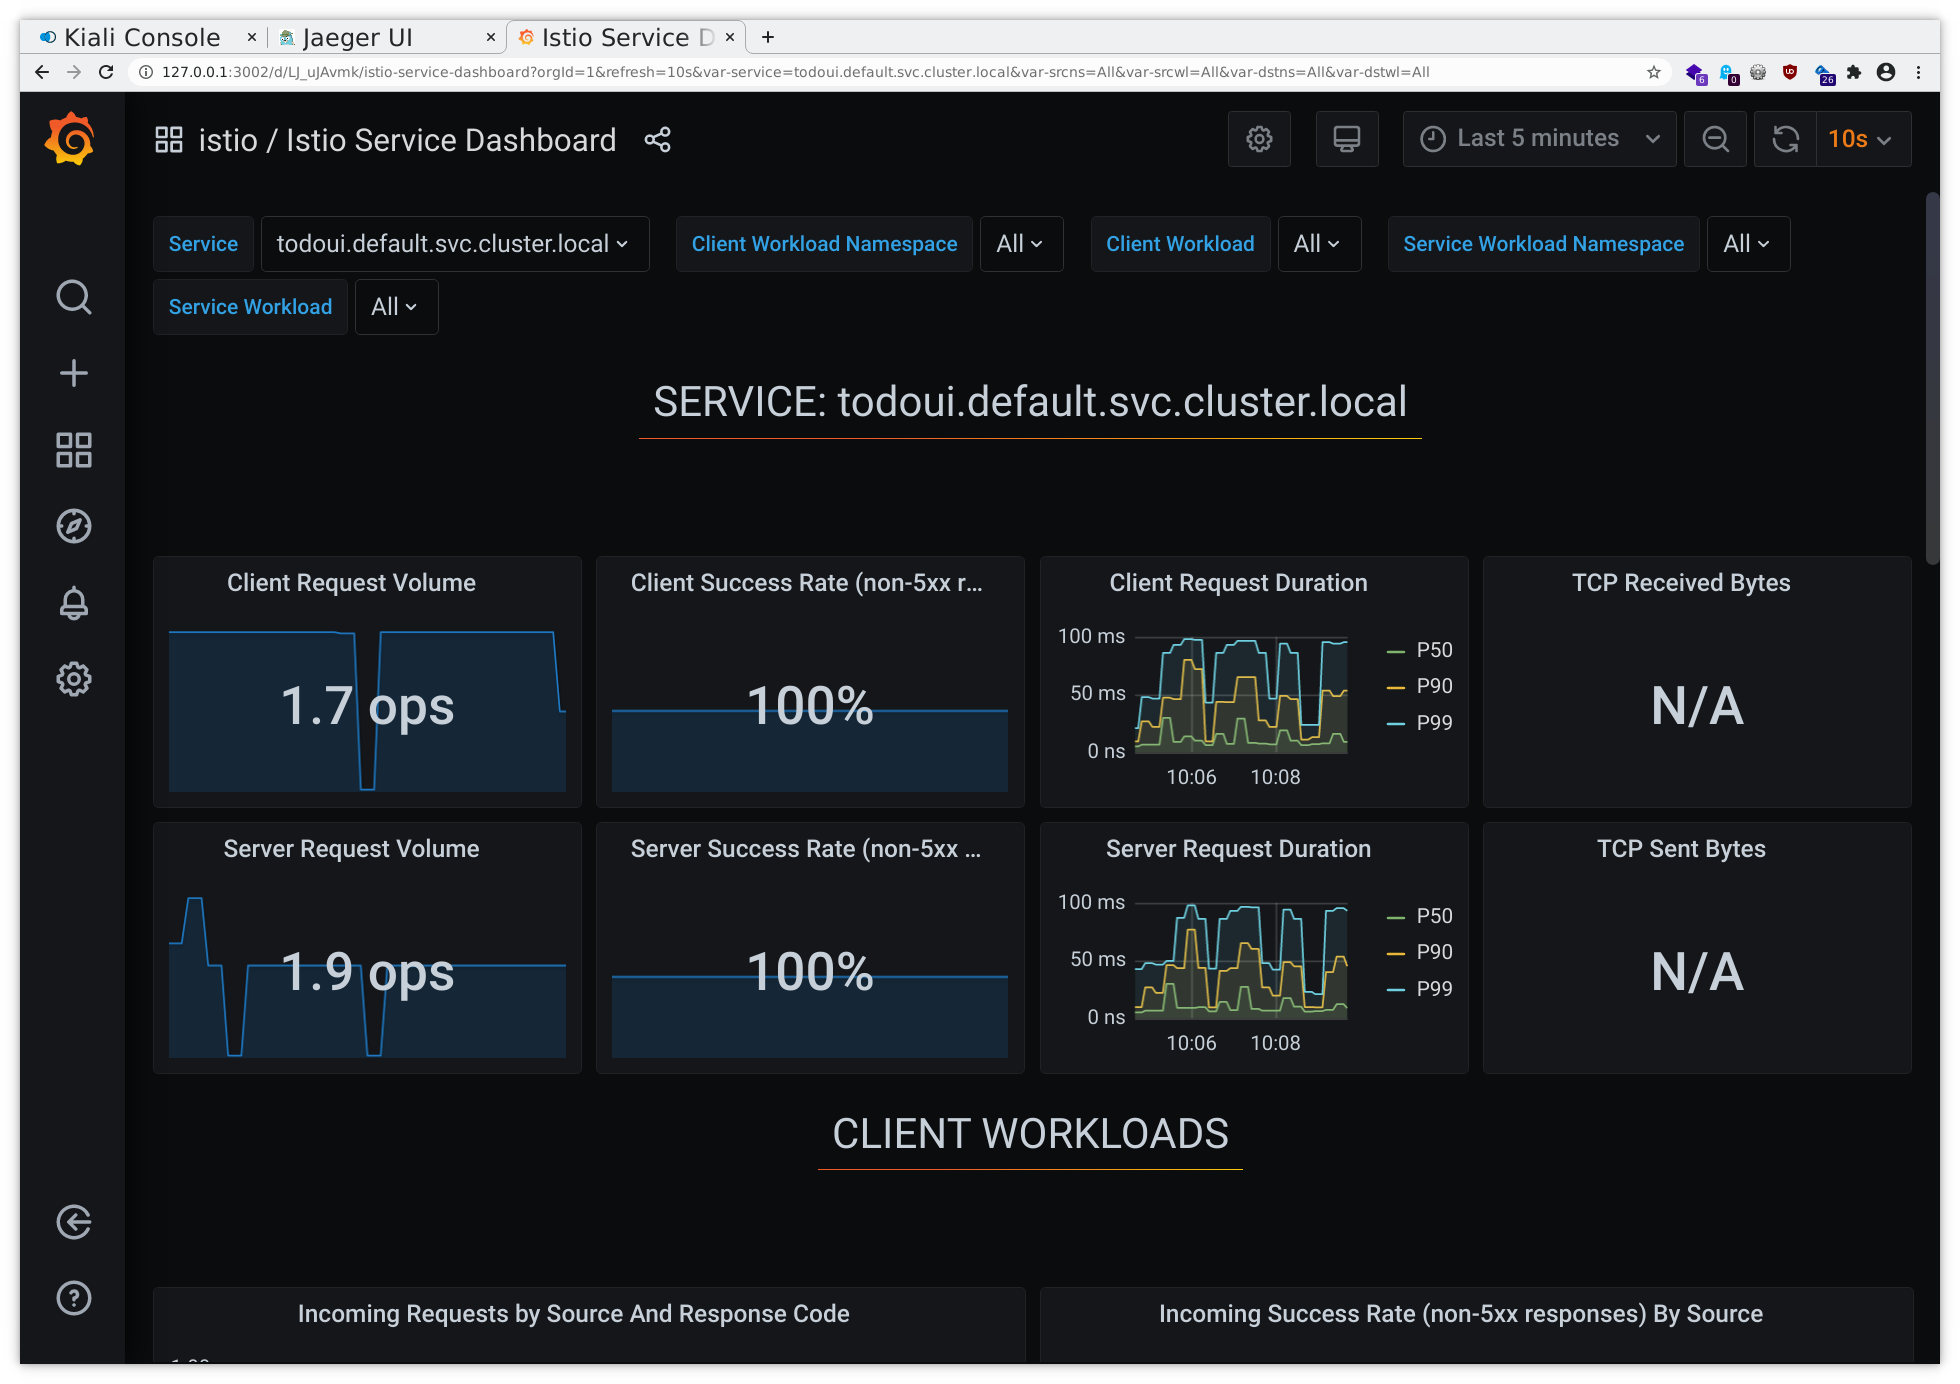
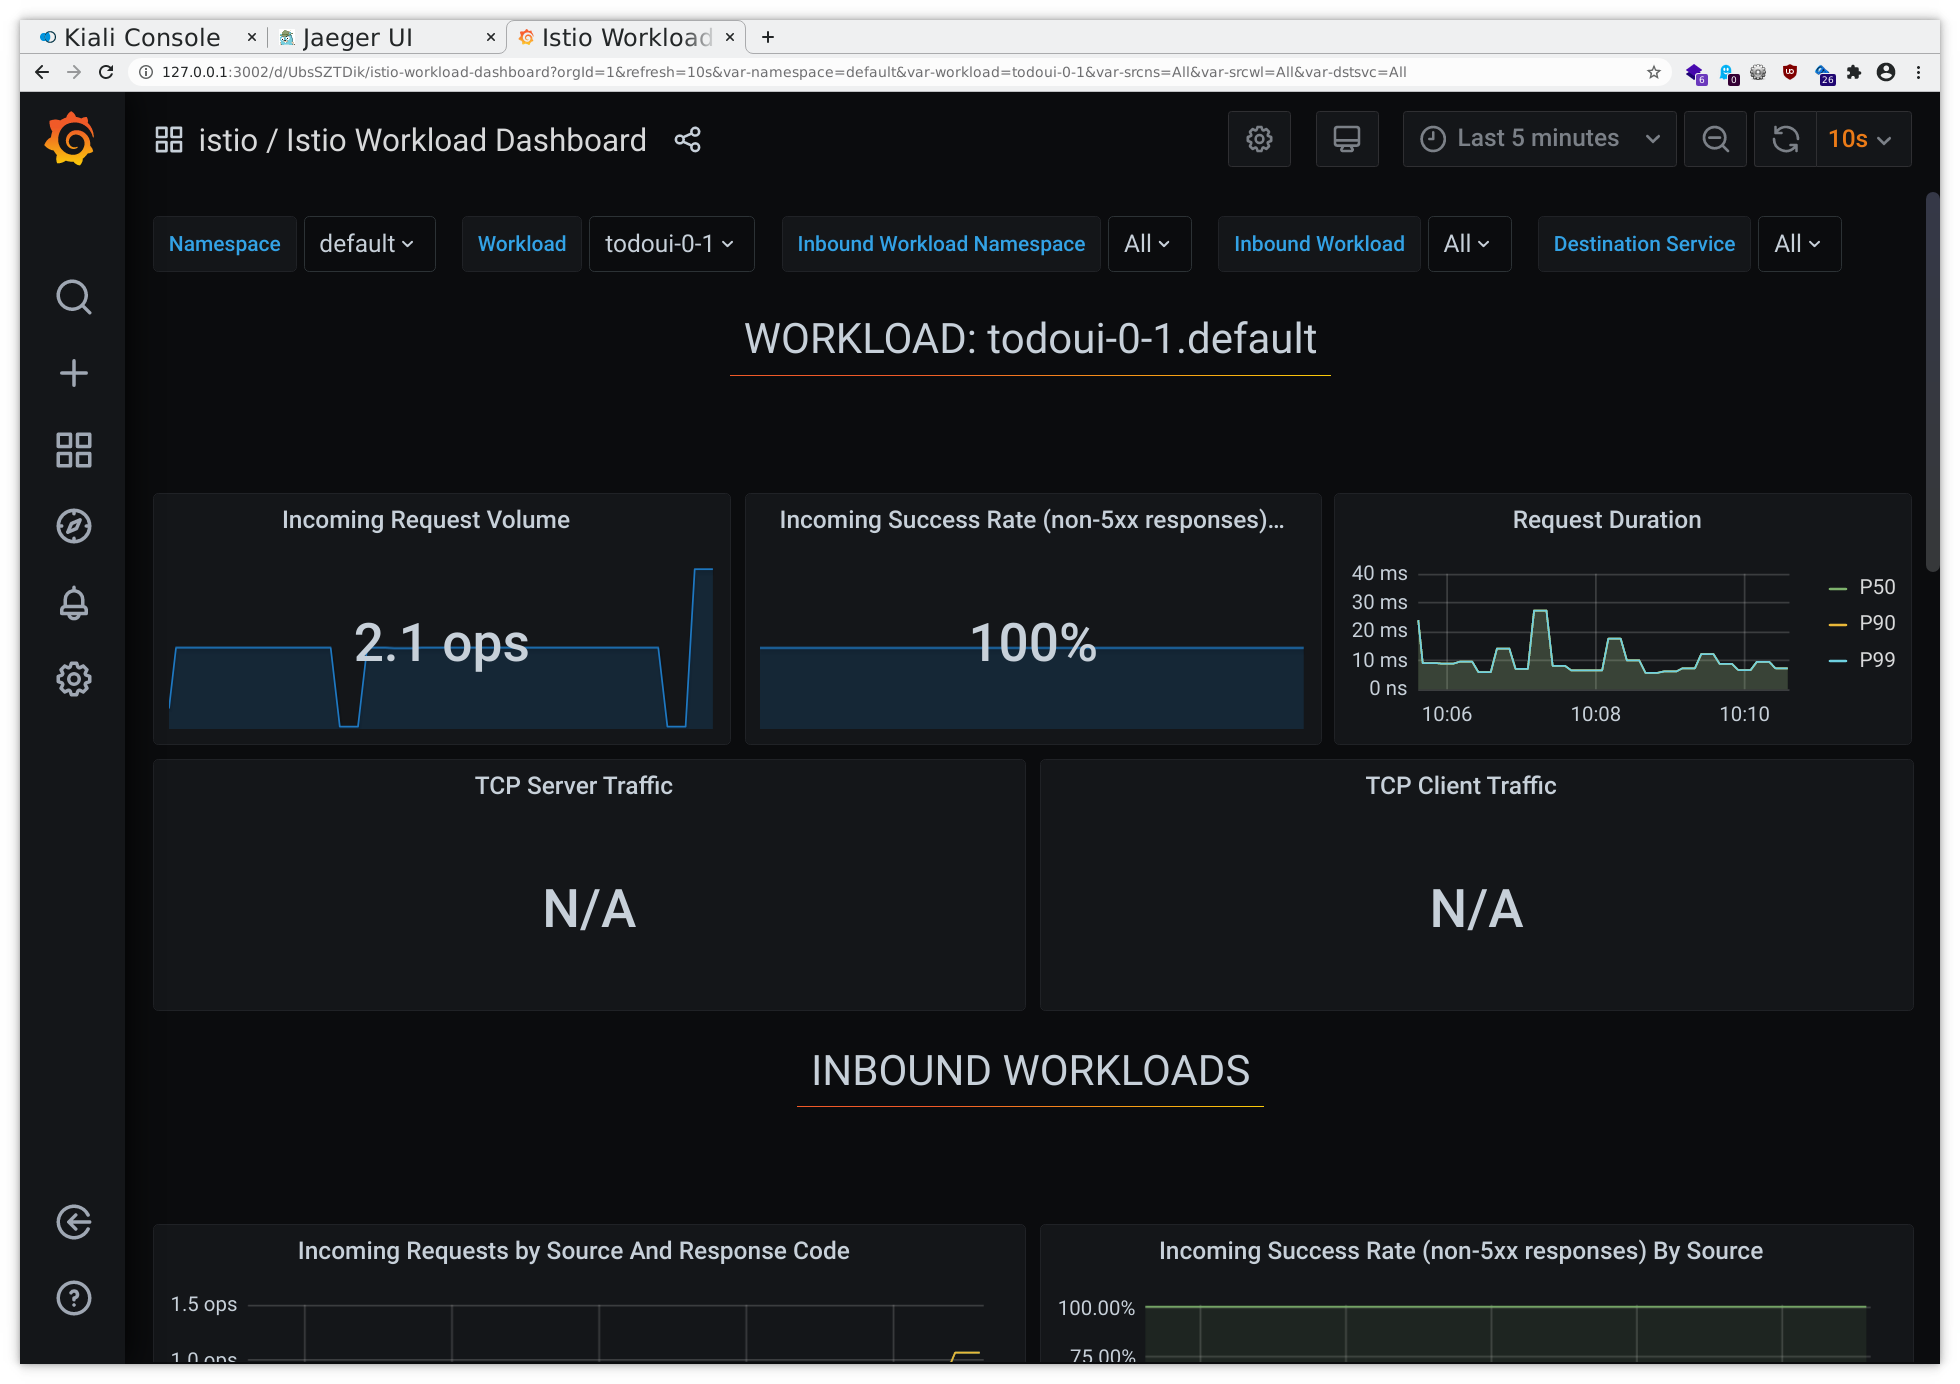
While the Kiali UI already displays some metrics graphs based on data collected by the Prometheus Add-On on its own, a Grafana Add-On is available as well.
So let’s open a port-forwarding to this service:
kubectl --namespace istio-system port-forward svc/grafana 3000:3000
Now you can follow the instructions for the port forwarding within your ssh client or Putty . Add a mapping from your local port 3000 to localhost:3000, and then you will be able to access this through your local browser at http://localhost:3000/ , using dual port-forwarding (first via ssh client, then via kubectl), and you should see the application like in the following sample pictures:
Furthermore, there are additional tools available in principle but not readily accessible from within our environment, like for viewing the dashboard of a raw Envoy data plane proxy as used by Istio via
istioctl dashboard envoy <pod-name>.<namespace>
and for checking the general state of your namespace via
istioctl analyze,
now listed here just for reference.
Exercise - Remove the Istio data plane proxies from our todo application
First of all you have to disable automatic data plane proxy injection for your namespace
kubectl label namespace $NAMESPACE istio-injection-
And then you can revert the proxy sidecar injection via fully recreating the Deployments from scratch (formerly there existed a istioctl experimental kube-uninject, but that was dropped with Istio v1.19):
kubectl apply -f postgres-storage.yaml
kubectl apply -f todobackend.yaml
kubectl apply -f todoui-versioned-0-2.yaml
kubectl apply -f todoui-versioned-0-3.yaml
# if in doubt just fully remove and recreate them
All Pods will be automatically recreated as per their respective Deployment resource.
If you are not planning on following the optional sample exercises for configuring an Opt-In Canary using Nginx or Traefik you can just delete the todoui-0-2 Deployment now:
kubectl delete deployment todoui-0-2
And once the remaining Pods are not meshed anymore they won’t be affected by Istio’s PeerAuthentication or the VirtualService in combination with the DestinationRules anymore. But as such, if you still have deployed parallel versions of the todoui component (i.e. you have chosen to no yet delete the todoui-0-2 Deployment), they will again receive requests at random now. Either way, basic accessibility can be confirmed via the LoadBalancer Service as follows.
First, export the required variables:
export NAMESPACE=$(kubectl config view --minify --output 'jsonpath={..namespace}'); echo $NAMESPACE
export LOADBALANCER_IP=$(kubectl get svc todoui -o jsonpath="{.status.loadBalancer.ingress[0].ip}"); echo $LOADBALANCER_IP
export CURL="curl --silent --location"
Then execute the following (Ctrl+C to cancel execution):
while sleep 1; do date; $CURL http://$LOADBALANCER_IP:8090 | grep ':-)'; done
Exercise - Configure Opt-In Canary using Nginx Ingress (Optional)
Just for the sake of comparison some brief snippets on how to set up cookie-based opt-in canary using Nginx Ingress, just as mentioned in the reality check . Check above for more details on the concepts.
This builds on top of Nginx Ingress , and of course requires that Istio won’t enforce strict mTLS anymore.
In brief:
Without Istio’s VirtualService and associated DestinationRules we have to create separate versioned Services for each versioned deployment and create corresponding Ingress resources, one of which will implement the canary (yes, execute it all at once).
cat <<.EOF > todoapp-ingress-cookie.yaml
apiVersion: v1
kind: Service
metadata:
  name: todoui-0-2
spec:
  type: ClusterIP
  ports:
    - port: 8090
  selector:
    app: todoui
    version: "0.2"
---
apiVersion: networking.k8s.io/v1
kind: Ingress
metadata:
  name: todo-nginx
  annotations:
    # the following setting is required to get metrics in linkerd's dashboard, but it will prevent canary from working as the latter would just copy it verbatim without any overridability
    #nginx.ingress.kubernetes.io/configuration-snippet: |
    #  proxy_set_header l5d-dst-override \$service_name.\$namespace.svc.cluster.local:\$service_port;
spec:
  ingressClassName: nginx
  tls:
    - hosts:
        - todo.$NAMESPACE.$INGRESS_IP_NGINX.nip.io
      secretName: todo-nginx-tls-secret
  rules:
    - host: todo.$NAMESPACE.$INGRESS_IP_NGINX.nip.io
      http:
        paths:
          - path: /
            pathType: Prefix
            backend:
              service:
                name: todoui-0-2
                port:
                  number: 8090
---
apiVersion: v1
kind: Service
metadata:
  name: todoui-0-3
spec:
  type: ClusterIP
  ports:
    - port: 8090
  selector:
    app: todoui
    version: "0.3"
---
apiVersion: networking.k8s.io/v1
kind: Ingress
metadata:
  name: todo-nginx-canary
  annotations:
    nginx.ingress.kubernetes.io/canary: "true"
    # beware, the specified cookie's contents must equal "always" to trigger the canary!
    nginx.ingress.kubernetes.io/canary-by-cookie: "featureflag"
spec:
  ingressClassName: nginx
  tls:
    - hosts:
        - todo.$NAMESPACE.$INGRESS_IP_NGINX.nip.io
      secretName: todo-nginx-tls-secret
  rules:
    - host: todo.$NAMESPACE.$INGRESS_IP_NGINX.nip.io
      http:
        paths:
          - path: /
            pathType: Prefix
            backend:
              service:
                name: todoui-0-3
                port:
                  number: 8090
.EOF
Apply this file via kubectl apply -f todoapp-ingress-cookie.yaml and check via
NAMESPACE=$(kubectl config view --minify --output 'jsonpath={..namespace}'); echo $NAMESPACE
INGRESS_IP_NGINX=$(kubectl get ingress todo-nginx -o jsonpath='{.status.loadBalancer.ingress[].ip}'); echo $INGRESS_IP_NGINX
CURL="curl --silent --location --insecure"
while sleep 1; do date; $CURL http://todo.$NAMESPACE.$INGRESS_IP_NGINX.nip.io/                               | grep ':-)'; done # Ctrl+C to cancel
while sleep 1; do date; $CURL http://todo.$NAMESPACE.$INGRESS_IP_NGINX.nip.io/ --cookie 'featureflag=always' | grep ':-)'; done # Ctrl+C to cancel
Yes, with Nginx Ingress the cookie must contain always. A placeholder result means todoui-0-2 is replying, and when the response contains the actual ToDo count it is todoui-0-3 replying.
As this concludes our usage of the Nginx Ingress during the course of these exercises feel free to just delete the resources now in order to keep our output clean:
kubectl delete -f todoapp-ingress-cookie.yaml
kubectl delete ingress todo-nginx-backend-basic-auth
If you are not planning on following the optional sample exercise for configuring an Opt-In Canary using Traefik you can just delete the todoui-0-2 Deployment now:
kubectl delete deployment todoui-0-2
Exercise - Configure Opt-In Canary using Traefik Ingress (Optional)
Just for the sake of comparison some brief snippets on how to set up cookie-based opt-in canary using Traefik Ingress, just as mentioned in the reality check . Check above for more details on the concepts.
This builds on top of Traefik Ingress , and of course requires that Istio won’t enforce strict mTLS anymore.
In brief:
Without Istio’s VirtualService and associated DestinationRules we have to create separate versioned Services for each versioned deployment and create corresponding Traefik IngressRoute resources, one of which will implement the canary (yes, execute it all at once).
cat <<.EOF > todoapp-ingress-traefik-cookie.yaml
apiVersion: v1
kind: Service
metadata:
  name: todoui-0-2
spec:
  type: ClusterIP
  ports:
    - port: 8090
  selector:
    app: todoui
    version: "0.2"
---
# Middleware just required for linkerd integration
apiVersion: traefik.io/v1alpha1
kind: Middleware
metadata:
  name: l5d-header-todo-app-traefik
spec:
  headers:
    customRequestHeaders:
      l5d-dst-override: "todoui-0-2.$NAMESPACE.svc.cluster.local:8090"
---
# rebuild using IngressRoute to avoid TLSOption mismatch warning
apiVersion: traefik.io/v1alpha1
kind: IngressRoute
metadata:
  name: todo-traefik
spec:
  entryPoints:
    - websecure
  routes:
    - kind: Rule
      match: Host(\`todo.$NAMESPACE.$INGRESS_IP_TRAEFIK.nip.io\`)
      middlewares:
        - name: l5d-header-todo-app-traefik
      services:
        - kind: Service
          name: todoui-0-2
          port: 8090
  tls:
    domains:
      - main: todo.$NAMESPACE.$INGRESS_IP_TRAEFIK.nip.io
    options:
      name: minversion
    secretName: todo-traefik-tls-secret
---
apiVersion: v1
kind: Service
metadata:
  name: todoui-0-3
spec:
  type: ClusterIP
  ports:
    - port: 8090
  selector:
    app: todoui
    version: "0.3"
---
# Middleware just required for linkerd integration
apiVersion: traefik.io/v1alpha1
kind: Middleware
metadata:
  name: l5d-header-todo-app-traefik-canary
spec:
  headers:
    customRequestHeaders:
      l5d-dst-override: "todoui-0-3.$NAMESPACE.svc.cluster.local:8090"
---
apiVersion: traefik.io/v1alpha1
kind: IngressRoute
metadata:
  name: todo-traefik-canary
spec:
  entryPoints:
    - websecure
  routes:
    - kind: Rule
      match: Host(\`todo.$NAMESPACE.$INGRESS_IP_TRAEFIK.nip.io\`) && HeadersRegexp(\`Cookie\`, \`^(.*?; ?)?(featureflag=on)(;.*)?$\`)
      middlewares:
        - name: l5d-header-todo-app-traefik-canary
      services:
        - kind: Service
          name: todoui-0-3
          port: 8090
  tls:
    domains:
      - main: todo.$NAMESPACE.$INGRESS_IP_TRAEFIK.nip.io
    options:
      name: minversion
    secretName: todo-traefik-tls-secret
.EOF
The old plain Ingress resource will need to be deleted as it overlaps with the new IngressRoute resource: kubectl delete ingress todo-traefik
Then apply this file via kubectl apply -f todoapp-ingress-traefik-cookie.yaml and check via
NAMESPACE=$(kubectl config view --minify --output 'jsonpath={..namespace}'); echo $NAMESPACE
INGRESS_IP_TRAEFIK=$(kubectl get ingress todo-traefik-redirect -o jsonpath='{.status.loadBalancer.ingress[].ip}'); echo $INGRESS_IP_TRAEFIK
CURL="curl --silent --location --insecure"
while sleep 1; do date; $CURL http://todo.$NAMESPACE.$INGRESS_IP_TRAEFIK.nip.io/                           | grep ':-)'; done # Ctrl+C to cancel
while sleep 1; do date; $CURL http://todo.$NAMESPACE.$INGRESS_IP_TRAEFIK.nip.io/ --cookie 'featureflag=on' | grep ':-)'; done # Ctrl+C to cancel
A placeholder result means todoui-0-2 is replying, and when the response contains the actual ToDo count it is todoui-0-3 replying.
As this concludes our usage of the Traefik Ingress during the course of these exercises feel free to just delete the resources now in order to keep our output clean:
kubectl delete -f todoapp-ingress-traefik-cookie.yaml
kubectl delete ingress todo-traefik-backend-basic-auth todo-traefik-redirect
If you are not planning on following the optional sample exercise for configuring an Opt-In Canary using Nginx you can just delete the todoui-0-2 Deployment now:
kubectl delete deployment todoui-0-2